
Mathematics, 11.12.2020 01:30 grace783
Part E
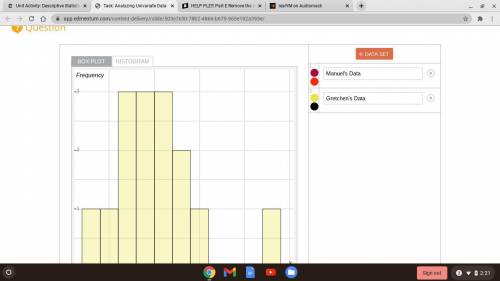
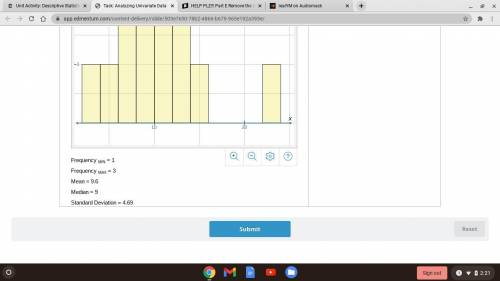
Remove the outlier from Gretchen’s data set, and recalculate the mean, median, standard deviation, and interquartile range. Use the graphing tool to visualize the data.
Question
Which statements are true about Gretchen’s adjusted data set?
The spread values are farther from the spread values of Manuel’s data set.
The center moved farther from the center of Manuel’s data set.
The data set is skewed left.
The center moved closer to the center of Manuel’s data set.
The data set is approximately symmetric.
The spread values are closer to the spread values of Manuel’s data set.

Answers: 1


Another question on Mathematics
Mathematics, 21.06.2019 20:10
The population of a small rural town in the year 2006 was 2,459. the population can be modeled by the function below, where f(x residents and t is the number of years elapsed since 2006. f(t) = 2,459(0.92)
Answers: 1
Mathematics, 21.06.2019 23:30
Find each value of the five-number summary for this set of data. [note: type your answers as numbers. do not round.] 150, 120, 136, 180, 158, 175, 124, 162 minimum maximum median upper quartile lower quartile
Answers: 1
Mathematics, 22.06.2019 01:10
Stefania pours 2 liters of orange juice and 1.5 liters of pineapple juice into a punch bowl. how many liters are in the punch bowl?
Answers: 1
Mathematics, 22.06.2019 02:40
The sum of two numbers is 0. twice the smaller number subtracted from 3 times the larger number is 10. let x represent the larger number and y represent the smaller number. what is the equation
Answers: 1
You know the right answer?
Part E
Remove the outlier from Gretchen’s data set, and recalculate the mean, median, standard devi...
Questions

Mathematics, 07.11.2019 05:31

Mathematics, 07.11.2019 05:31
Mathematics, 07.11.2019 05:31
Mathematics, 07.11.2019 05:31


