
Mathematics, 11.12.2020 06:00 Hazy095
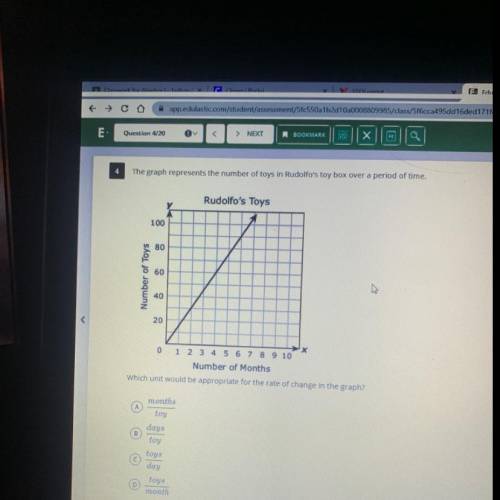
The graph represents the number of toys in Rudolfo's toy box over a period of time.
Rudolfo's Toys
100
80
60
Number of Toys
40
20
X
0 1 2 3 4 5 6 7 8 9 10
Number of Months
Which unit would be appropriate for the rate of change in the graph?
A
B
months
toy
days
toy
toys
day
toys
month
D

Answers: 2


Another question on Mathematics
Mathematics, 21.06.2019 18:40
Which of the following represents the range of the graph of f(x) below
Answers: 1
Mathematics, 21.06.2019 19:00
Hector and alex traded video games. alex gave hector one fourth of his video games in exchange for 6 video games. then he sold 3 video games and gave 2 video games to his brother. alex ended up with 16 video games. how many video games did alex have when he started?
Answers: 2
Mathematics, 21.06.2019 19:00
In a class, there are 12 girls. if the ratio of boys to girls is 5: 4 how many boys are there in the class
Answers: 1
You know the right answer?
The graph represents the number of toys in Rudolfo's toy box over a period of time.
Rudolfo's Toys<...
Questions
Mathematics, 19.05.2020 16:04
Mathematics, 19.05.2020 16:04

Mathematics, 19.05.2020 16:04
Mathematics, 19.05.2020 16:04

Biology, 19.05.2020 16:04

Mathematics, 19.05.2020 16:04
Mathematics, 19.05.2020 16:04

Mathematics, 19.05.2020 16:05

Mathematics, 19.05.2020 16:05

English, 19.05.2020 16:05
Mathematics, 19.05.2020 16:05


