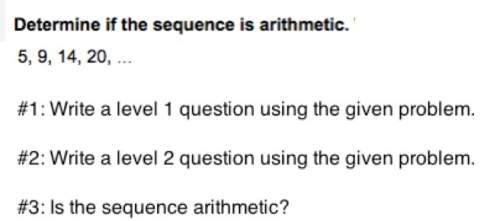
plz asap
data shown in a frequency table could be displayed in which of the following graphs...

Mathematics, 10.10.2019 13:00 bks53
plz asap
data shown in a frequency table could be displayed in which of the following graphs? (choose all that apply.)
a. bar graph
b. stem-and-leaf plot
c. line plot
d. line graph
and harambe just because.


Answers: 2


Another question on Mathematics

Mathematics, 21.06.2019 15:00
Explain why the function is discontinuous at the given number a. (select all that apply.) f(x) = 1 x + 1 a = −1 f(−1) is undefined. lim x→−1+ f(x) and lim x→−1− f(x) exist, but are not equal. lim x→−1 f(x) does not exist. f(−1) and lim x→−1 f(x) exist, but are not equal. none of the above
Answers: 3

Mathematics, 21.06.2019 16:30
Brainlest answer can you find the area and circumference of a circle given the radius or diameter? if its yes or no explain why
Answers: 1

Mathematics, 21.06.2019 21:00
In the field of thermodynamics, rankine is the unit used to measure temperature. one can convert temperature from celsius into rankine using the formula , what is the temperature in celsius corresponding to r degrees rankine? a. 9/5(c - 273) b. 9/5(c + 273) c. 5/9( c - 273) d. 5/9( c + 273)
Answers: 1

You know the right answer?
Questions


Mathematics, 03.08.2019 11:00


English, 03.08.2019 11:00

English, 03.08.2019 11:00

Mathematics, 03.08.2019 11:00


Mathematics, 03.08.2019 11:00


Biology, 03.08.2019 11:00

Physics, 03.08.2019 11:00


