NO HORSING AROUND
Horse Corral Enclosure
Barn
AGO
1800
X
X
1600...

Mathematics, 13.12.2020 05:10 miathegeek97
NO HORSING AROUND
Horse Corral Enclosure
Barn
AGO
1800
X
X
1600
1400
Corral Diagram
1200
1000
Area (ft
I
800
600
400
200
10 20
30 40 50
Width (ft)
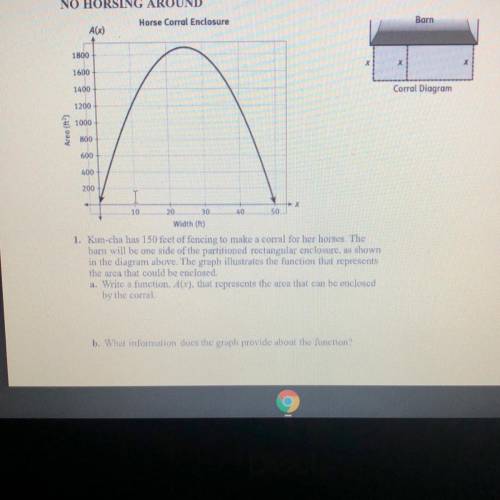
1. Kun-cha has 150 feet of fencing to make a corral for her horses. The
barn will be one side of the partitioned rectangular enclosure as shown
in the diagram above. The graph illustrates the function that represents
the area that could be enclosed.
a. Write a function, don) that represents the area that can be enclosed
by the correl

Answers: 3


Another question on Mathematics
Mathematics, 21.06.2019 15:00
The head librarian at the library of congress has asked her assistant for an interval estimate of the mean number of books checked out each day. the assistant provides the following interval estimate: from 740 to 920 books per day. what is an efficient, unbiased point estimate of the number of books checked out each day at the library of congress?
Answers: 3
Mathematics, 21.06.2019 16:00
Part one: measurements 1. measure your own height and arm span (from finger-tip to finger-tip) in inches. you will likely need some from a parent, guardian, or sibling to get accurate measurements. record your measurements on the "data record" document. use the "data record" to you complete part two of this project. name relationship to student x height in inches y arm span in inches archie dad 72 72 ginelle mom 65 66 sarah sister 64 65 meleah sister 66 3/4 67 rachel sister 53 1/2 53 emily auntie 66 1/2 66 hannah myself 66 1/2 69 part two: representation of data with plots 1. using graphing software of your choice, create a scatter plot of your data. predict the line of best fit, and sketch it on your graph. part three: the line of best fit include your scatter plot and the answers to the following questions in your word processing document 1. 1. which variable did you plot on the x-axis, and which variable did you plot on the y-axis? explain why you assigned the variables in that way. 2. write the equation of the line of best fit using the slope-intercept formula $y = mx + b$. show all your work, including the points used to determine the slope and how the equation was determined. 3. what does the slope of the line represent within the context of your graph? what does the y-intercept represent? 5. use the line of best fit to you to describe the data correlation.
Answers: 2
Mathematics, 21.06.2019 22:30
What three-dimensional solid have 6 rectangular faces, 2 equal bases that are not rectangles and 18 edges
Answers: 3
Mathematics, 22.06.2019 00:50
Given: ab ≅ bc and ao ≅ oc ok − angle bisector of ∠boc find: m∠aok
Answers: 2
You know the right answer?
Questions
Mathematics, 15.10.2019 07:10

Social Studies, 15.10.2019 07:10

Computers and Technology, 15.10.2019 07:10
Mathematics, 15.10.2019 07:10

Mathematics, 15.10.2019 07:10

Social Studies, 15.10.2019 07:10

Mathematics, 15.10.2019 07:10
Mathematics, 15.10.2019 07:10

Chemistry, 15.10.2019 07:10
History, 15.10.2019 07:10
Chemistry, 15.10.2019 07:10
Biology, 15.10.2019 07:10
Physics, 15.10.2019 07:10


