
Mathematics, 13.12.2020 08:40 hannahgracew12
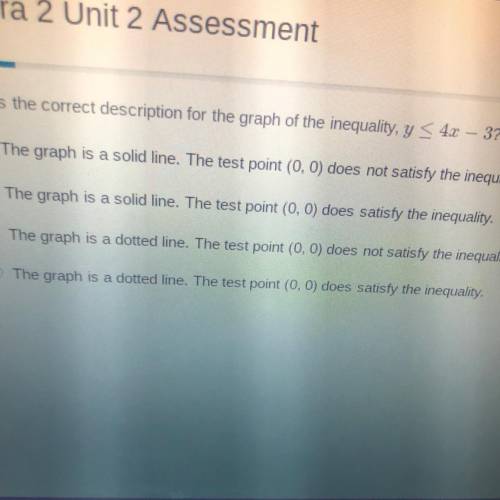
What is the correct description for the graph of the inequality, y < 42 – 3?
The graph is a solid line. The test point (0, 0) does not satisfy the inequality.
The graph is a solid line. The test point (0,0) does satisfy the inequality.
The graph is a dotted line. The test point (0, 0) does not satisfy the inequality.
The graph is a dotted line. The test point (0, ) does satisfy the inequality.

Answers: 2


Another question on Mathematics
Mathematics, 21.06.2019 21:00
Glenda makes an online purchase for picture frames for $12.95 each and formats of $5.89 each the site says it taxes paid by the customer or 6.5% of the total purchase price shipping charges are based on the
Answers: 1
Mathematics, 21.06.2019 22:00
Melanie is buying a bathing suit that costs 39.99. she is given a discount at the cash register of $6.00 when she scratched 15% off on a game piece for a store promotion. what will the sale price of melanie’s bathing suit be?
Answers: 1
Mathematics, 22.06.2019 03:00
Edith is shopping for a new leather couch. jordan’s furniture has one that costs $3,000. however, this weekend she can get a 15% discount. how much money will edith save if she buys the couch this weekend? a $15b $2,550c $45,000d $450
Answers: 1
You know the right answer?
What is the correct description for the graph of the inequality, y < 42 – 3?
The graph is a soli...
Questions


Mathematics, 22.09.2020 01:01

History, 22.09.2020 01:01
History, 22.09.2020 01:01

English, 22.09.2020 01:01
Mathematics, 22.09.2020 01:01
Mathematics, 22.09.2020 01:01

Advanced Placement (AP), 22.09.2020 01:01
English, 22.09.2020 01:01
History, 22.09.2020 01:01


