
Mathematics, 14.12.2020 18:00 reeseleprell7655
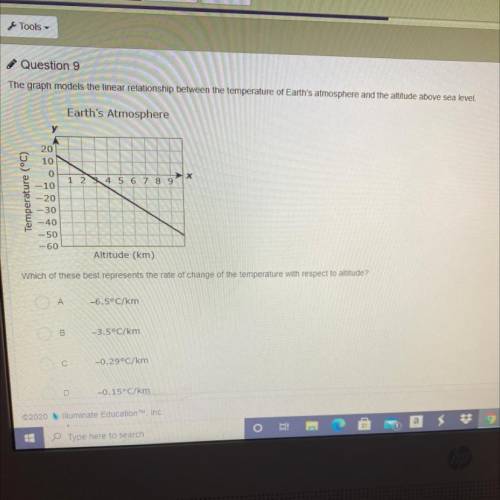
The graph models the linear relationship between the temperature of Earth's atmosphere and the altitude above sea level.
Earth's Atmosphere
y
1
2
4 5 6 7 8 9
Temperature
(°C)
20
10
O
-10
-20
-30
-40
-50
-60
Altitude (km)
Which of these best represents the rate of change of the temperature with respect to altitude
A-6.5°C/km
B- 3.5°C/km
C-0.29°C/km
D-0.15°C/km

Answers: 1


Another question on Mathematics
Mathematics, 21.06.2019 13:30
I'm being volume of cylinder with 13 in. radius and 30 in height answer choices in pic
Answers: 2
Mathematics, 21.06.2019 15:00
Find the balance at the end of 4 years if 1000 is deposited at the rate of
Answers: 2
Mathematics, 21.06.2019 16:30
Which ordered pair (c,d) is a solution to the given system of linear equations- c+2d=13 -9c-4d=-15
Answers: 3
Mathematics, 21.06.2019 19:00
How many solutions does the nonlinear system of equations graphed bellow have?
Answers: 1
You know the right answer?
The graph models the linear relationship between the temperature of Earth's atmosphere and the altit...
Questions

History, 18.07.2019 17:30


Computers and Technology, 18.07.2019 17:30


English, 18.07.2019 17:30


