Mathematics, 14.12.2020 18:10 benjaminatkinson1
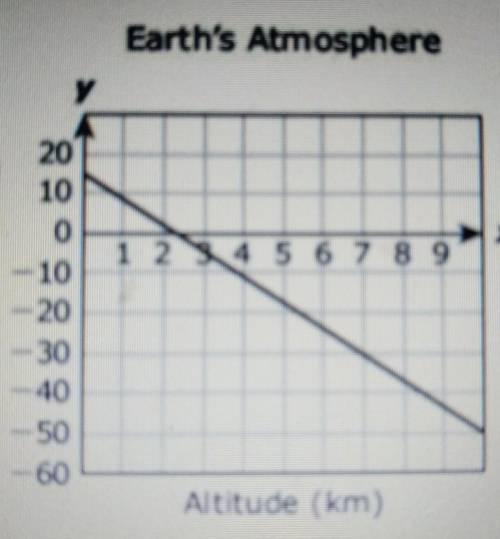
The graph models the linear relationship between the temperature of Earth's atmosphere and the altitude above sea level. Earth's Atmosphere Which of these best represents the rate of change of the temperature with respect to altitude? -6.5°C/km -3.5°C/km -0.29°C/km -0.15°C/km


Answers: 1


Another question on Mathematics

Mathematics, 21.06.2019 16:00
Asegment in the complex plane has a midpoint at 7 – 2i. if the segment has an endpoint at 11 – 3i, what is the other endpoint?
Answers: 1

Mathematics, 21.06.2019 20:30
The cost of using a service is $0.25 per min. what equation correctly represents the total cost c, in dollars, for d days of use?
Answers: 2

Mathematics, 21.06.2019 20:50
What is the greatest number of parts of a circle that can be formed by cutting the circle with 7 straight cuts? (note: the parts do not have to be equal in size)
Answers: 3

Mathematics, 22.06.2019 02:30
Alarger number is double the sum of a smaller number. the larger number is 2 less than 3 times the smaller number. if y represents the larger number and x represents the smaller number, which equations model the situation
Answers: 1
You know the right answer?
The graph models the linear relationship between the temperature of Earth's atmosphere and the altit...
Questions

English, 17.12.2019 10:31

Biology, 17.12.2019 10:31

Social Studies, 17.12.2019 10:31

Biology, 17.12.2019 10:31


Mathematics, 17.12.2019 10:31

Physics, 17.12.2019 10:31


Mathematics, 17.12.2019 10:31

Mathematics, 17.12.2019 10:31


Chemistry, 17.12.2019 10:31

Biology, 17.12.2019 10:31


