
Mathematics, 14.12.2020 23:50 zmirandalove100
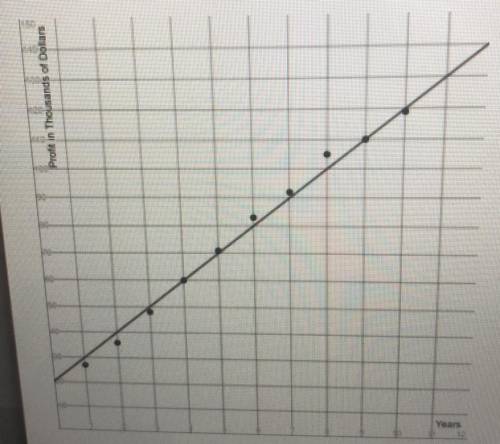
The graph shows the amount of profit in thousands of dollars for a toy each year .A scatter plot of the data is shown below with the line of best fit .
What statement are true related to the line of best fit ? Select all that apply
A. the amount of profit after the first year was around $0.
B. the amount of profit increases about $10,000 each year.
C. the amount of profit decreases about $10,000 each year.
D. the amount of profit after the first year was around $30,000.
E. The amount of profit after 10 years is approximately $120,000.

Answers: 3


Another question on Mathematics
Mathematics, 21.06.2019 15:00
Ateacher has $80 to buy workbooks. each work book cost $3. if she buys as many workbooks as possible, how much money does she have leftover? a) $2 b) $4 c) $6 d) $8
Answers: 1
Mathematics, 21.06.2019 16:20
Refer to interactive solution 17.45 to review a method by which this problem can be solved. the fundamental frequencies of two air columns are the same. column a is open at both ends, while column b is open at only one end. the length of column a is 0.504 m. what is the length of column b?
Answers: 1
Mathematics, 21.06.2019 17:50
Find the cosine function that is represented in the graph.
Answers: 1
Mathematics, 21.06.2019 18:20
What is the solution set of the quadratic inequality x2- 5< 0? o {xl-55x55{x- 155x55){xl -55x5 15){x1 - 15 sx5/5)
Answers: 2
You know the right answer?
The graph shows the amount of profit in thousands of dollars for a toy each year .A scatter plot of...
Questions


Social Studies, 05.05.2020 16:07


Mathematics, 05.05.2020 16:07

English, 05.05.2020 16:07
English, 05.05.2020 16:07

History, 05.05.2020 16:07
Mathematics, 05.05.2020 16:07
English, 05.05.2020 16:07
Mathematics, 05.05.2020 16:07


