
Mathematics, 15.12.2020 01:00 JoeyDoesMath2399
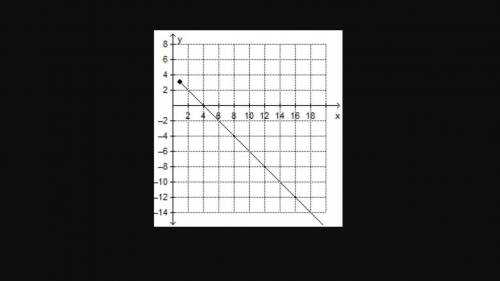
The graph represents a functional relationship.
Which value is an input of the function?
–14
–2
0
4
HELP ASAP

Answers: 1


Another question on Mathematics
Mathematics, 22.06.2019 00:00
Which of the following is the maximum value of the equation y=-x^2+2x+5 a. 5 b. 6 c. 2. d. 1
Answers: 1
Mathematics, 22.06.2019 02:30
Astudent found the solution below for the given inequality. |x-9|< -4 x-9> 4 and x-9< -4 x> 13 and x< 5 which of the following explains whether the student is correct? -the student is completely correct because the student correctly wrote and solved the compound inequality. -the student is partially correct because only one part of the compound inequality is written correctly. -the student is partially correct because the student should have written the statements using “or” instead of “and.” -the student is completely incorrect because there is no solution to this inequality.
Answers: 2
Mathematics, 22.06.2019 03:30
Identify the number as a rational or irrational.explai. 291.87
Answers: 2
Mathematics, 22.06.2019 07:40
The table shows the times allison clocked in and out of work this week. how many total hours did she work? time in time out 8: 03 am 5: 13 pm 7: 58 am 4: 49 pm 7: 46 am 4: 41 pm 8: 23 am 4: 50 pm 7: 31 am 4: 32 pm
Answers: 2
You know the right answer?
The graph represents a functional relationship.
Which value is an input of the function?
Questions
Mathematics, 14.12.2020 23:00


Mathematics, 14.12.2020 23:00
Mathematics, 14.12.2020 23:00

Mathematics, 14.12.2020 23:00
English, 14.12.2020 23:00


Chemistry, 14.12.2020 23:00
Mathematics, 14.12.2020 23:00


