
Mathematics, 15.12.2020 18:30 shahedalahmad2017
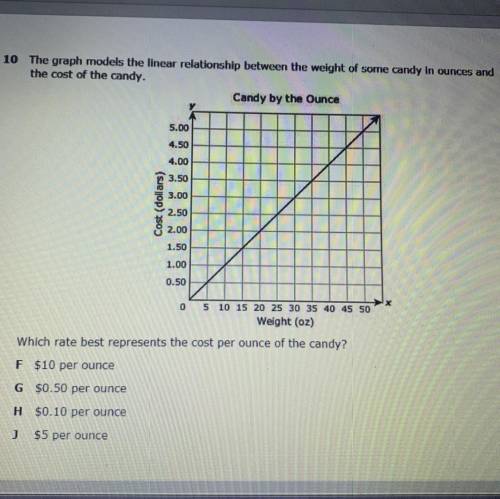
10 The graph models the linear relationship between the weight of some candy in ounces and
the cost of the candy.
Candy by the Ounce
5.00
4.50
4.00
3.50
3.00
Cost (dollars)
2.50
2.00
1.50
1.00
0.50
0 5 10 15 20 25 30 35 40 45 50
Weight (oz)
Which rate best represents the cost per ounce of the candy?
F $10 per ounce
G $0.50 per ounce
H $0.10 per ounce
J $5 per ounce

Answers: 3


Another question on Mathematics
Mathematics, 21.06.2019 14:30
In trapezoid efgh, m∠hef=(4x2+16)∘ and m∠gfe=(5x2+12)∘. find the value of x so that efgh is isosceles.
Answers: 1
Mathematics, 21.06.2019 23:30
Ateacher wanted to buy a chair, a bookshelf, two tables and a desk. she spent $900 for all five items and the chair and the desk combined 70% of her total. if the bookshelf cost $50, how much did each of the tables cost?
Answers: 1
You know the right answer?
10 The graph models the linear relationship between the weight of some candy in ounces and
the cost...
Questions

Advanced Placement (AP), 18.09.2019 09:00


Mathematics, 18.09.2019 09:00
English, 18.09.2019 09:00

Health, 18.09.2019 09:00


History, 18.09.2019 09:00
Mathematics, 18.09.2019 09:00
Mathematics, 18.09.2019 09:00
English, 18.09.2019 09:00
Mathematics, 18.09.2019 09:00


