
Mathematics, 16.12.2020 02:40 isabellajmoody
SUPER SURVEY SIMULATOR. ED KIDS HELP
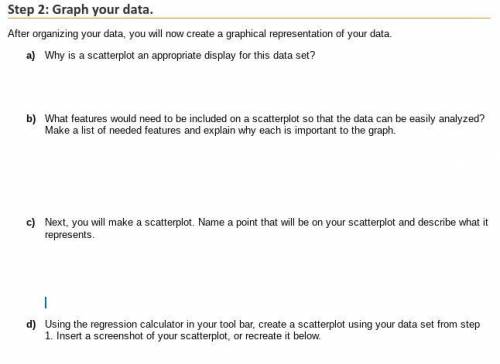
A. Why is a scatterplot an appropriate display for this data set?
B. What features would need to be included on a scatterplot so that the data can be easily analyzed? Make a list of needed features and explain why each is important to the graph.
C. Next, you will make a scatterplot. Name a point that will be on your scatterplot and describe what it represents.
D. Using the regression calculator in your tool bar, create a scatterplot using your data set from step 1. Insert a screenshot of your scatterplot, or recreate it below.
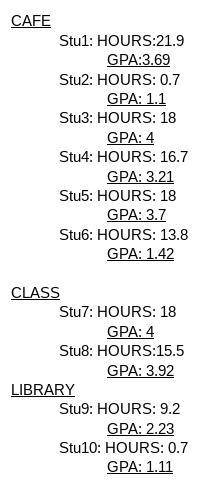
MY DATA I COLLETED IS IN ONE SCREENSHOT THE OTHER SCREENSHOT IS THE INSTRUCTIONS FOR THIS PROJECT IF YOUVE NEVER SEEN THIS
IF YOUVE DONE THIS BEFORE AND HAVE THE FINISHED DOCUMENT PLS TEXT ME xoohaileyy ON IN$T4 <3 same for snapch4t.
I RLLY NEED HELP SO IF YOU DONT KNOW THE ANSWER PLS ASK SOMEONE WHO DOES ED

Answers: 1


Another question on Mathematics
Mathematics, 21.06.2019 17:00
Use the frequency distribution, which shows the number of american voters (in millions) according to age, to find the probability that a voter chosen at random is in the 18 to 20 years old age range. ages frequency 18 to 20 5.9 21 to 24 7.7 25 to 34 20.4 35 to 44 25.1 45 to 64 54.4 65 and over 27.7 the probability that a voter chosen at random is in the 18 to 20 years old age range is nothing. (round to three decimal places as needed.)
Answers: 1
Mathematics, 21.06.2019 23:00
Which of the following graphs could represent a cubic function?
Answers: 1
Mathematics, 22.06.2019 01:00
Mr. t has been dating his girlfriend for one year nine months and six days how many hours has mr. t been in a relationship
Answers: 1
Mathematics, 22.06.2019 04:10
A. 2.3y +2 +3.1y = 4.3y + 1.6 + 1.1y + 0.4 b. + 25 - = c. 5/8x + 2.5 = 3/8x + 1.5 + 1/4x d. 1/3 + 1/7y = 3/7y
Answers: 2
You know the right answer?
SUPER SURVEY SIMULATOR. ED KIDS HELP
A. Why is a scatterplot an appropriate display for this data s...
Questions


Social Studies, 20.07.2019 00:40

Advanced Placement (AP), 20.07.2019 00:40

Mathematics, 20.07.2019 00:40
Mathematics, 20.07.2019 00:40
History, 20.07.2019 00:40
Mathematics, 20.07.2019 00:40


