
Mathematics, 16.12.2020 03:20 bapefer498
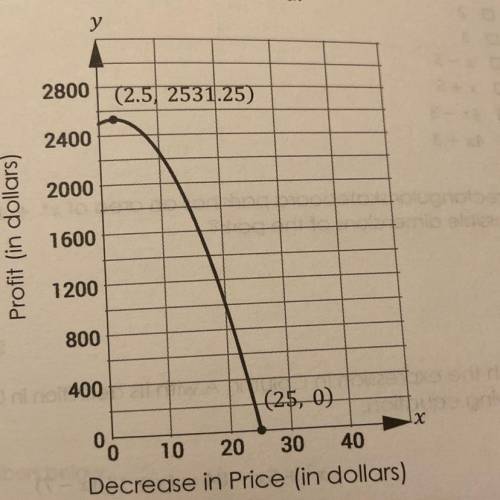
The function below shows the revenue for t-shirt sales. For every $1
decrease in price, 5 more t-shirts can be sold.
Part A: What it the maximum of this graph and what does the maximum
represent?
Part B: What is the y-intercept of the graph? What does it represent?
Part C: Does the graph have solution(s)? If so, identify the solution and
what it represents.

Answers: 1


Another question on Mathematics
Mathematics, 20.06.2019 18:04
Mp model with mathematics explain how the number of text messages dario sent and the cost form an arithmetic sequence.then write an expression to find dario's text messaging bill if he sends n text messages over 250.
Answers: 2
Mathematics, 21.06.2019 19:00
Write a function for a rotation 90 degrees counter clockwise about the origin, point 0
Answers: 1
Mathematics, 21.06.2019 20:00
Michael is training for a marathon. in his first week he plans to run 8miles. what path should he take
Answers: 1
Mathematics, 22.06.2019 01:00
If log(a) = 1.2 and log(b)= 5.6, what is log(a/b)? a. 4.4b. 6.8c. not enough informationd. -4.4
Answers: 1
You know the right answer?
The function below shows the revenue for t-shirt sales. For every $1
decrease in price, 5 more t-sh...
Questions

Chemistry, 15.09.2021 14:00
Mathematics, 15.09.2021 14:00

English, 15.09.2021 14:00
Mathematics, 15.09.2021 14:00
Mathematics, 15.09.2021 14:00
Mathematics, 15.09.2021 14:00
Mathematics, 15.09.2021 14:00

Mathematics, 15.09.2021 14:00

Arts, 15.09.2021 14:00
Arts, 15.09.2021 14:00
Mathematics, 15.09.2021 14:00


