
Mathematics, 17.12.2020 01:20 libbybacon7
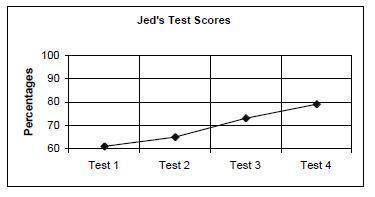
Explain what a graph for Jed’s test scores {61%, 65%, 73%, and 79%} would look like if it was not misleading. Make sure it is different than Jed’s graph – that some may say are misleading. Please Help Me

Answers: 3


Another question on Mathematics
Mathematics, 21.06.2019 12:40
The figure above shows the lengths of thesides of a rectangle in cm. find the valuesof x and y and then the area of the rectangle.sides: top= 3x - yleft= 3y + 4bottom= 2x + yright= 2x - 3 use both methods, elimination and substitution, if possible.
Answers: 1
Mathematics, 21.06.2019 18:00
What is the measure of angle tvu shown in the diagram below
Answers: 2
Mathematics, 21.06.2019 19:30
Solve the following inequalities and show the solution on a number line. 2x+3< 3(4x+5)
Answers: 1
Mathematics, 21.06.2019 22:00
What is the equation of the line that is parallel to the line with the equation y= -3/4x +1 and passes through the point (12,-12)
Answers: 1
You know the right answer?
Explain what a graph for Jed’s test scores {61%, 65%, 73%, and 79%} would look like if it was not mi...
Questions

Mathematics, 24.01.2020 07:31

English, 24.01.2020 07:31

Mathematics, 24.01.2020 07:31

Chemistry, 24.01.2020 07:31
Mathematics, 24.01.2020 07:31
Mathematics, 24.01.2020 07:31
Mathematics, 24.01.2020 07:31
English, 24.01.2020 07:31


Biology, 24.01.2020 07:31
Mathematics, 24.01.2020 07:31

Advanced Placement (AP), 24.01.2020 07:31


