(25 points)
Which inequality is represented by the graph?
O y > -2/3x + 1
O y < -...

Mathematics, 17.12.2020 14:00 briannmalcolmp3l4pz
(25 points)
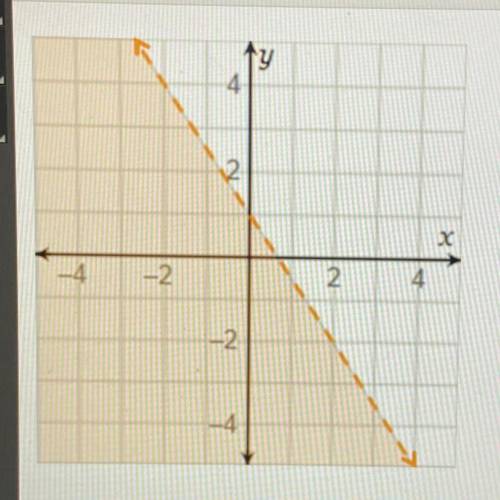
Which inequality is represented by the graph?
O y > -2/3x + 1
O y < -2/3x + 1
O y < -3/2x + 1
O y > -3/2x + 1

Answers: 1


Another question on Mathematics
Mathematics, 21.06.2019 23:00
Someone answer this asap for the function f(x) and g(x) are both quadratic functions. f(x) = x² + 2x + 5 g(x) = x² + 2x - 1 which statement best describes the graph of g(x) compared to the graph of f(x)? a. the graph of g(x) is the graph of f(x) shifted down 1 units. b. the graph of g(x) is the graph of f(x) shifted down 6 units. c. the graph of g(x) is the graph of f(x) shifted to the right 1 unit. d. the graph of g(x) is the graph of f(x) shifted tothe right 6 units.
Answers: 3
Mathematics, 21.06.2019 23:50
The graph of a curve that passes the vertical line test is a:
Answers: 3
Mathematics, 22.06.2019 00:20
One file clerk can file 10 folders per minute. a second file clerk can file 11 folders per minute. how many minutes would the two clerks together take to file 672 folders?
Answers: 1
You know the right answer?
Questions


Mathematics, 11.05.2021 16:50

Mathematics, 11.05.2021 17:00
Mathematics, 11.05.2021 17:00
Business, 11.05.2021 17:00
Mathematics, 11.05.2021 17:00
English, 11.05.2021 17:00

Chemistry, 11.05.2021 17:00


Arts, 11.05.2021 17:00
Biology, 11.05.2021 17:00
English, 11.05.2021 17:00


