
Mathematics, 17.12.2020 14:00 jeffersonpaul283
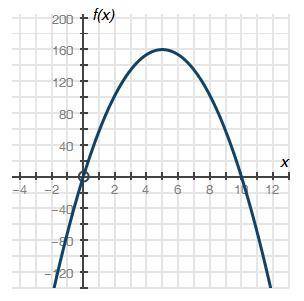
The graph below shows a company's profit f(x), in dollars, depending on the price of pencils x, in dollars, sold by the company:
Graph of quadratic function f of x having x intercepts at ordered pairs negative 0, 0 and 10, 0. The vertex is at 5, 160.
Part A: What do the x-intercepts and maximum value of the graph represent? What are the intervals where the function is increasing and decreasing, and what do they represent about the sale and profit? (4 points)
Part B: What is an approximate average rate of change of the graph from x = 2 to x = 5, and what does this rate represent? (3 points)
Part C: Describe the constraints of the domain. (3 points)

Answers: 2


Another question on Mathematics
Mathematics, 21.06.2019 15:30
Guests at an amusement park must be at least 54 inches tall to be able to ride the roller coaster. which graph represents the set of heights that satisfy this requirement?
Answers: 3
Mathematics, 21.06.2019 19:00
Which shows the correct substitution of the values a,b and c from the equation 1=-2x+3x^2+1
Answers: 1
Mathematics, 21.06.2019 20:00
You are shooting hoops after school and make 152 out of a total of 200. what percent of shots did you make? what percent did you miss? show proportion(s).
Answers: 1
You know the right answer?
The graph below shows a company's profit f(x), in dollars, depending on the price of pencils x, in d...
Questions

Mathematics, 26.06.2019 20:00


Chemistry, 26.06.2019 20:00


Mathematics, 26.06.2019 20:00

Spanish, 26.06.2019 20:00
Biology, 26.06.2019 20:00
History, 26.06.2019 20:00
Mathematics, 26.06.2019 20:00


History, 26.06.2019 20:00


