
Mathematics, 18.12.2020 04:50 shayyy49
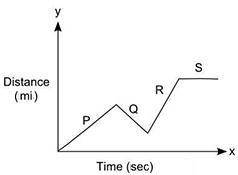
The graph shows the distance Ted traveled from the market in miles (y) as a function of time in seconds (x). The graph is divided into four segments labeled P, Q, R, and S.
Graph shows 4 segments. Segment P is a slanting straight line going up. Segment Q is a slanting line going down. Segment R is a slanting straight line going up. Segment S is a horizontal straight line parallel to the x-axis.
Which segment shows Ted waiting for a cab?
P
Q
R
S

Answers: 1


Another question on Mathematics
Mathematics, 21.06.2019 19:20
Suppose that a households monthly water bill (in dollars) is a linear function of the amount of water the household uses (in hundreds of cubic feet, hcf). when graphed, the function gives a line with slope of 1.65. if the monthly cost for 13 hcf is $46.10 what is the monthly cost for 19 hcf?
Answers: 3
Mathematics, 21.06.2019 22:00
cassidy wants to cut the yellow fabric into strips that are 0.3 yards wide. how many strips of yellow fabric can cassidy make? yellow fabric 16 yards for $108.00.
Answers: 1
Mathematics, 21.06.2019 23:00
Astore sells 4 apples for $3 and 3 oranges for $4 if pete buys 12 apples and 12 oranges how much will it cost
Answers: 1
You know the right answer?
The graph shows the distance Ted traveled from the market in miles (y) as a function of time in seco...
Questions


Mathematics, 10.05.2021 21:00

Health, 10.05.2021 21:00

Mathematics, 10.05.2021 21:00

English, 10.05.2021 21:00


