
Mathematics, 18.12.2020 20:50 meramera50
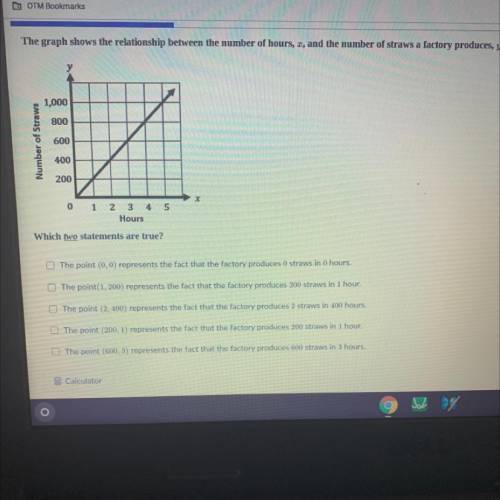
The graph shows the relationship between the number of hours, I, and the number of straws a factory produces, y.
1,000
800
Number of Straws
600
V
400
200
0
1 2 3 4 5
Hours
Which two statements are true?
The point (0,0) represents the fact that the factory produces 0 straws in 0 hours.
The point(1, 200) represents the fact that the factory produces 200 straws in 1 hour.
The point (2,400) represents the fact that the factory produces 2 straws in 400 hours.
The point (200, 1) represents the fact that the factory produces 200 straws in 1 hour
The point (600,3) represents the fact that the factory produces 600 straws in 3 hours.
m Calculator

Answers: 1


Another question on Mathematics
Mathematics, 21.06.2019 17:00
Adifferent website gives the cost for the first train as £56.88 and the second train as £20.11 with a £9.50 charge for cycle storage for the whole trip. how much would the journey cost you?
Answers: 1
Mathematics, 21.06.2019 17:10
How many lines can be drawn through points j and k? 0 1 2 3
Answers: 2
Mathematics, 21.06.2019 19:30
At the electronics store you have a coupon for 20% off up to 2 cds you buy for cds with the original cost of $10.99 each the sales tax is 5% what is the total cost of your purchase
Answers: 1
Mathematics, 21.06.2019 20:00
Simplify (2^5/3^2)^4 a. 2^20/3^8 b. 2^9/3^8 c. 8^5/12^2 d. 2/3^2
Answers: 1
You know the right answer?
The graph shows the relationship between the number of hours, I, and the number of straws a factory...
Questions


Mathematics, 22.06.2019 10:50

Chemistry, 22.06.2019 10:50
Mathematics, 22.06.2019 10:50
Mathematics, 22.06.2019 10:50
Mathematics, 22.06.2019 10:50
Mathematics, 22.06.2019 10:50

History, 22.06.2019 10:50

Computers and Technology, 22.06.2019 10:50


