
Mathematics, 20.12.2020 09:50 boog89
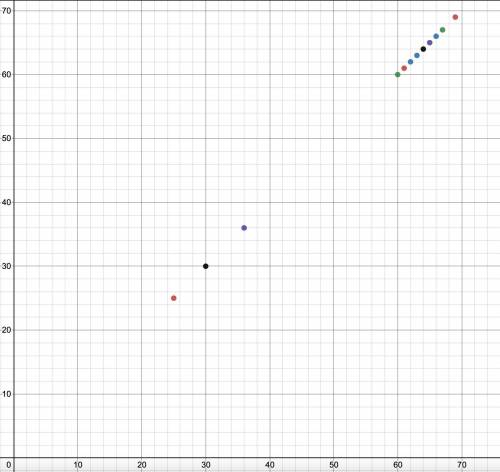
1. Which variable did you plot on the x-axis, and which variable did you plot on the y-axis? Explain why you assigned the variables in that way.
2. Write the equation of the line of best fit using the slope-intercept formula $y = mx + b$. Show all your work, including the points used to determine the slope and how the equation was determined.
3. What does the slope of the line represent within the context of your graph? What does the y-intercept represent?
4. Test the residuals of two other points to determine how well the line of best fit models the data.
5. Use the line of best fit to help you to describe the data correlation.
6. Using the line of best fit that you found in Part Three, Question 2, approximate how tall is a person whose arms span is 66 inches?
7. According to your line of best fit, what is the arm span of a 74-inch-tall person?
I have 5-7 done and I've included a picture of my graph down below I just really need number 1 and 2 at the moment but any question answered through 1 and 4 would we very appreciated :)

Answers: 1


Another question on Mathematics
Mathematics, 21.06.2019 15:30
Mary works for a company that ships packages and must measure the size of each box that needs to be shipped. mary measures a box and finds the length is 7 inches, the width is 14 inches, and the height is 15 inches. what is the volume of the box? [type your answer as a number.]
Answers: 1
Mathematics, 21.06.2019 17:00
Benito is selecting samples of five values from the table, which row will result in the greatest mean? population data row 1 4 2 2 3 3 row 2 3 3 4 3 2 row 3 2 4 3 4 3 row 4 3 4 4 7 3 row 1 row 2 r
Answers: 3
Mathematics, 21.06.2019 22:40
What rotation was applied to triangle def to create d’e’f’?
Answers: 2
Mathematics, 21.06.2019 23:30
In order for the function to be linear, what must m be and why? m = 22 because the rate of change is 1. m = 20 because the rate of change is 3. m = 22 because the rate of change is -1. m = 20 because the rate of change is -3.
Answers: 2
You know the right answer?
1. Which variable did you plot on the x-axis, and which variable did you plot on the y-axis? Explain...
Questions

English, 19.03.2020 21:32

English, 19.03.2020 21:32
Mathematics, 19.03.2020 21:32


English, 19.03.2020 21:32

Physics, 19.03.2020 21:32


