
Mathematics, 20.12.2020 22:00 jayp02
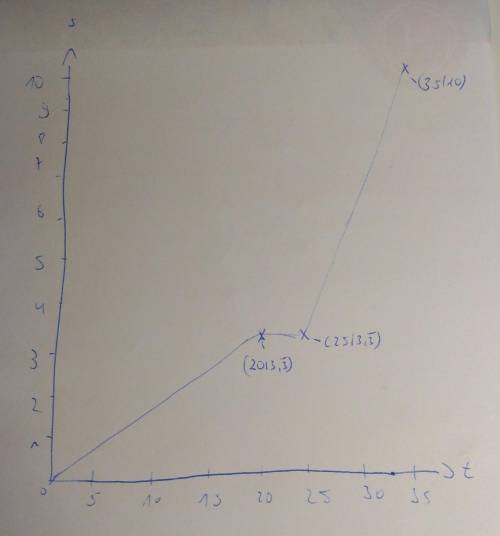
 Please create a graph to reflect the following situation:
Max is going to school. For the first 20 minutes he walks at a constant speed of 10 miles per hour. Then he gets to the bus stop and waits for the bus for another 5 minutes. Then he rides the bus for 10 minutes. The speed of the bus is 40 miles per hour.
Show graphically the distance Max has traveled to school over time since he has left his house.
Make sure you include the name of the graph, the labels and the scale on x- and y-axes; Please use graphing paper, pencil and a ruler. Please help me it’s due today I would love the help.

Answers: 3


Another question on Mathematics
Mathematics, 21.06.2019 14:30
Rai compares two cable plans from different companies. which equation gives the correct value of mm, the number of months for which plans a and b cost the same?
Answers: 2
Mathematics, 21.06.2019 16:00
Use set builder notation to represent the following set: { -3, -2, -1, 0}
Answers: 1
Mathematics, 21.06.2019 16:00
Write the expression as a constant , a single trigonometric function, or a power of a trigonometric function. sin x cos x/ tan x
Answers: 1
Mathematics, 21.06.2019 18:30
Me complete this proof! prove that a quadrilateral is a square. me with the steps for this proof.
Answers: 1
You know the right answer?
 Please create a graph to reflect the following situation:
Max is going to school. For the first 2...
Questions


Mathematics, 20.02.2020 03:35
Biology, 20.02.2020 03:35
Mathematics, 20.02.2020 03:35
English, 20.02.2020 03:35

Geography, 20.02.2020 03:35


Computers and Technology, 20.02.2020 03:35


