
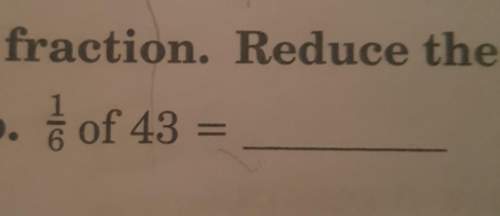
Mathematics, 21.12.2020 19:20 thajaalalqo
A mathematics teacher wanted to see the correlation between test scores and homework. The homework grade (x) and test grade (y) are given in the accompanying table. Write the linear regression equation that represents this set of data, rounding all coefficients to the nearest tenth. Using this equation, estimate the homework grade, to the nearest integer, for a student with a test grade of 31.
Homework Grade (x) Test Grade (y)
6262 4747
8989 8080
8585 8484
8787 8585
7272 6868
7474 7878
8282 8282

Answers: 3


Another question on Mathematics
Mathematics, 21.06.2019 17:30
What is the range of the relation in the table below? x y –2 0 –1 2 0 4 1 2 2 0
Answers: 3
Mathematics, 21.06.2019 20:00
The art class is planning to paint a mural on an outside wall. this figure is a scale drawing of the wall. width: 11 in length: 28 in unit rate: 1.5 ft per in. write the ratio of the area of the drawing to the area of the actual mural. write your answer as a unit rate. show that this unit rate is equal to the square of the unit rate 1.5 ft per in
Answers: 1
Mathematics, 21.06.2019 20:30
The number of 8th graders who responded to a poll of 6th grade and 8 th graders was one fourtg of the number of 6th graders whi responded if a total of 100 students responddd to the poll how many of the students responded were 6 th graders
Answers: 1
Mathematics, 21.06.2019 22:30
Varies inversely with x. if y=8.5 when x=-1 find x when y=-1
Answers: 1
You know the right answer?
A mathematics teacher wanted to see the correlation between test scores and homework. The homework g...
Questions

Mathematics, 27.08.2020 14:01

Geography, 27.08.2020 14:01

History, 27.08.2020 14:01

Social Studies, 27.08.2020 14:01
Mathematics, 27.08.2020 14:01
Mathematics, 27.08.2020 14:01

Social Studies, 27.08.2020 14:01

History, 27.08.2020 14:01
Physics, 27.08.2020 14:01


