
Mathematics, 26.12.2020 03:30 Hellopeople233
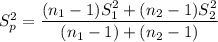
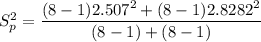
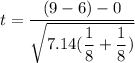
McAllister et al. (2012) compared varsity football and hockey players with varsity athletes from noncontact sports to determine whether exposure to head impacts during one season have an effect on cognitive performance. In the study, tests of new learning performance were significantly poorer for the contact sport athletes compared to the noncontact sport athletes. The following table presents data similar to the results obtained in the study.
Noncontact Athletes:
10, 8, 7, 9, 13, 7, 6, 12
Contact Athletes:
7, 4, 9, 3, 7, 6, 10, 2
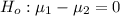
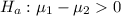
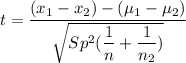
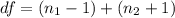
a. Are the test scores significantly lower for the contact sport athletes than for the noncontact athletes? Use a one-tailed test with \alpha=.05
t-critical=
t=
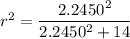
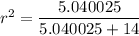
b. Compute the value of (percentage of variance accounted for) for these data.
r^2= a. 0.123, b. 0.239, c. 0.138, d. 0.264

Answers: 1


 and there is sufficient evidence to conclude that the test scores for contact address s less than Noncontact athletes.


Another question on Mathematics
Mathematics, 21.06.2019 16:30
Acircle has a circumference of 2 pi cm. which statement about the circumference and area is true? a comparison of the area and circumference is not possible since the area cannot be determined. the numerical values of the circumference and area of the circle are equal. the numerical value of the circumference is greater than the numerical value of the area. the numerical value of the circumference is less than the numerical value of the area.
Answers: 3
Mathematics, 21.06.2019 17:00
The table shows population statistics for the ages of best actor and best supporting actor winners at an awards ceremony. the distributions of the ages are approximately bell-shaped. compare the z-scores for the actors in the following situation. best actor best supporting actor muequals42.0 muequals49.0 sigmaequals7.3 sigmaequals15 in a particular year, the best actor was 59 years old and the best supporting actor was 45 years old. determine the z-scores for each. best actor: z equals best supporting actor: z equals (round to two decimal places as needed.) interpret the z-scores. the best actor was (more than 2 standard deviations above more than 1 standard deviation above less than 1 standard deviation above less than 2 standard deviations below) the mean, which (is not, is) unusual. the best supporting actor was (less than 1 standard deviation below more than 1 standard deviation above more than 2 standard deviations below more than 1 standard deviation below) the mean, which (is is not) unusual.
Answers: 1
Mathematics, 21.06.2019 22:00
The customer price index(cpi), which measures the cost of a typical package of customer goods,was 208.8 in 2011 and 244.1 in 2016.let x=11 corresponding to the year 2011 an estimate to cpi into 2013 and 2014. assume that the data can be modeled by a straight line and the trend to continue idenfinitely.use data points to find such a line and then estimate the requested quantities
Answers: 1
Mathematics, 21.06.2019 22:20
The mean of 10 values is 19. if further 5 values areincluded the mean becomes 20. what is the meanthese five additional values? a) 10b) 15c) 11d) 22
Answers: 1
You know the right answer?
McAllister et al. (2012) compared varsity football and hockey players with varsity athletes from non...
Questions


Geography, 18.03.2021 01:30


Mathematics, 18.03.2021 01:30

Mathematics, 18.03.2021 01:30

Computers and Technology, 18.03.2021 01:30
Mathematics, 18.03.2021 01:30

Biology, 18.03.2021 01:30


