
Mathematics, 27.12.2020 15:50 Alizerodriguez2010
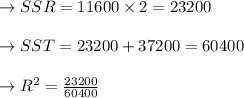
A marketing researcher conducted a multiple regression analysis to explain how much customers spend on a company’s products (Amount Spent) as a function of four customer characteristics/variables: annual salary (Salary), number of children (Children), age (Age), and location (Location; rural or urban). Use the two partial ANOVA tables from regression analysis below to determine how much additional variation (as a percentage) in Amount Spent can be explained by Salary and Children, together, over-and-above Age and Location:
MODEL 1: Amount Spent = f(Age, Location)
SSE = 37,200 MSR = 11,600
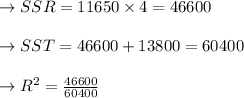
MODEL 2: Amount Spent = f(Age, Location, Salary, Children)
SSE = 13,800 MSR = 11,650
a. 62.90%
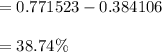
b. 38.74%
c. 26.96%
d. 58.97%

Answers: 3


Another question on Mathematics
Mathematics, 21.06.2019 23:30
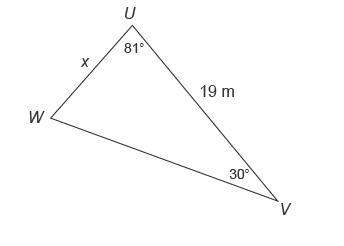
Astraight water slide is 175 feet above ground and is 200 feet long. what is the angle of depression to the bottom of the slide?
Answers: 1
Mathematics, 22.06.2019 03:20
The equation ip| = 2 represents the total number of points that can be earned or lost during one turn of a game. which best describes how many points can be earned or lost during one turn?
Answers: 1
Mathematics, 22.06.2019 04:50
What is the equation of the line written in general form? 0-x+y-2-2 ox+y-2=0 02x+4-2=0
Answers: 2
You know the right answer?
A marketing researcher conducted a multiple regression analysis to explain how much customers spend...
Questions

Advanced Placement (AP), 11.03.2021 23:00

Mathematics, 11.03.2021 23:00

Mathematics, 11.03.2021 23:00

English, 11.03.2021 23:00

History, 11.03.2021 23:00

Physics, 11.03.2021 23:00
Business, 11.03.2021 23:00
Mathematics, 11.03.2021 23:00
Mathematics, 11.03.2021 23:00


