(A). 
Step-by-step explanation:
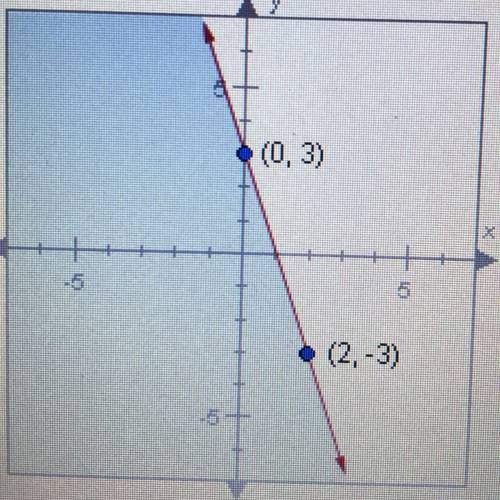
The equation of any straight line; a linear equation, can be interpreted as  , where 'm' is the slope of the line, 'b', is the y-intercept, and the values of 'x' and 'y' are simply coordinates!
Let's find the slope of the straight line, and that can be done in various ways. Since they gave us two points, I would use the following formula to find slope: 
Let's assign each coordinate(s) to correspond to the formula (It doesn't matter what order, as long as you follow the rule that you've set up).
 So now that know this, we can just plug in the values that we know, which we already know everything.

 → This then gives us;
  , which means the slope is -3! Now we have one part of the equation. This means that we can easily eliminate options B and D since they give a slope of positive three, which is false.
Now, let's move onto the y-intercept. How do we solve that? The y-intercept is generally known as a point that crosses the y-axis. This means that the x value is always going to be zero. This means that we know the point on the graph is:  . So all we have to do is use that information, and look at the graph! It looks like there is a point that does an x-value of zero.
We can see that the point we are looking at is;  , and the y-value is only what we are looking for. So now, we know that several components of the graph. We know so far that the slope is -3 and the line crosses the y-axis at (0,3), now we move on to determine the inequality part of the graph.
There are rules that determine how a graph is shaded—and let's figure that out.
Shading above the line is represented when 'y' is greater than the inequality itself.
Shading below the line is represented when 'y' is less than the inequality.
The shading occurs below the line, right? That means y is less than the inequality, and since the line is solid, the line can also equal the inequality. Now; with all of this to mind, y is less than or equal to -3x +3 is written or known as; , which means the answer is A.