0

Mathematics, 28.12.2020 16:20 paige1616
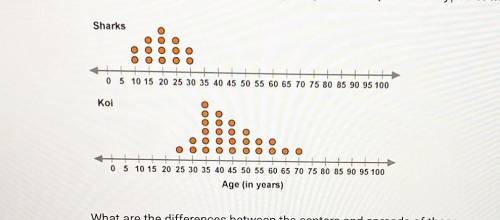
These dot plots show the ages (in years) for a sample of two types of fish.
Sharks
0
5 10 15 20 25 30 35 40 45 50 55 60 65 70 75 80 85 90 95 100
Koi
000000+
00000
0 5 10 15 20 25 30 35 40 45 50 55 60 65 70 75 80 85 90 95 100
Age (in years)
What are the differences between the centers and spreads of these
distributions?
Select two choices: one for the centers and one for the spreads.

Answers: 2


Another question on Mathematics
Mathematics, 21.06.2019 19:30
You have 17 cats that live in houses on your street, 24 dogs, 3 fish, and 4 hamsters. what percent of animals on your block are dogs?
Answers: 2
Mathematics, 21.06.2019 19:40
Molly shared a spool of ribbon with 12 people. each person received 3 feet of ribbon. which equation can she use to find r, the number of feet of ribbon that her spool originally had?
Answers: 1
Mathematics, 21.06.2019 20:30
Merrida uses a pattern in the multiplication table below to find ratios that are equivalent to 7: 9. if merrida multiplies the first term, 7, by a factor of 6, what should she do to find the other term for the equivalent ratio? multiply 9 by 1. multiply 9 by 6. multiply 9 by 7. multiply 9 by 9.
Answers: 1
Mathematics, 21.06.2019 21:30
Aladder that is 20ft long is leaning against the side of a building. if the angle formed between the ladder and the ground is 75 degrees how far is the bottom of the from the base of the building?
Answers: 1
You know the right answer?
These dot plots show the ages (in years) for a sample of two types of fish.
Sharks
0
0
Questions


Social Studies, 02.09.2019 10:30


History, 02.09.2019 10:30
Chemistry, 02.09.2019 10:30
Mathematics, 02.09.2019 10:30
Mathematics, 02.09.2019 10:30
Chemistry, 02.09.2019 10:30

English, 02.09.2019 10:30


