
Mathematics, 30.12.2020 04:10 pssluke
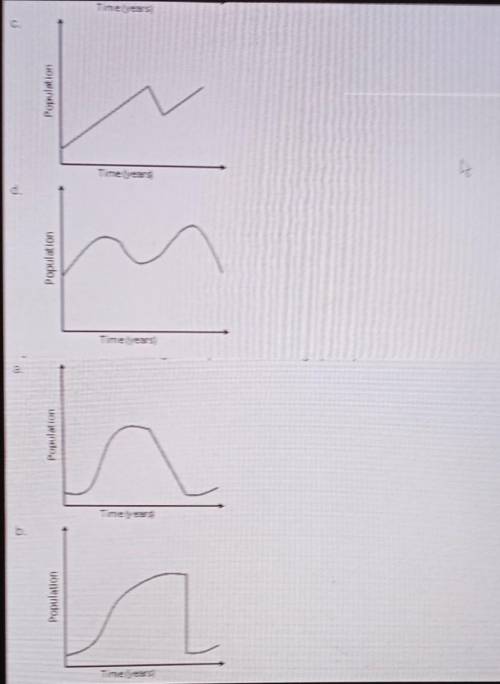
The population of fish in a pond in relation to the number of years since stocking is depicted on a graph. For the first few years after the pond is stocked, the population grows slowly. It increases more quickly as the fish reproduce, then it levels off. A pollutant kills off almost all of the fish 20 years after stocking. The population begins to grow again when the remaining fish reproduce. Which graph depicts the situation described above?

Answers: 3


Another question on Mathematics
Mathematics, 21.06.2019 16:30
What could explain what happened when the time was equal to 120 minutes
Answers: 2
Mathematics, 21.06.2019 19:00
The length of a rectangular piece of land is 92 yards more than three times its width. the perimeter is 760 yards. find its dimensions.
Answers: 1
Mathematics, 21.06.2019 23:40
For a function f(x), a) if f(7) = 22 then f^-1(22) = b) f^-1(f(c)) =
Answers: 2
You know the right answer?
The population of fish in a pond in relation to the number of years since stocking is depicted on a...
Questions
Mathematics, 29.10.2020 04:50

Geography, 29.10.2020 04:50


Arts, 29.10.2020 04:50

Chemistry, 29.10.2020 04:50
Mathematics, 29.10.2020 04:50

English, 29.10.2020 04:50
Mathematics, 29.10.2020 04:50

Business, 29.10.2020 04:50
Mathematics, 29.10.2020 04:50


