
Mathematics, 01.01.2021 05:40 eeeeee9848
Please Help ASAP!!
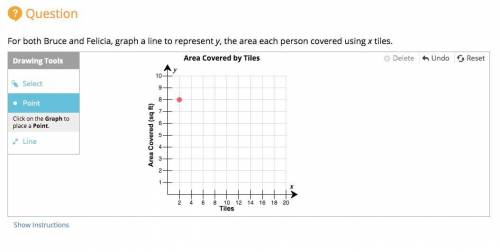
In this activity, you will use equations and graphs to represent real-world relationships and use them to draw conclusions about the relationships.
The tiles that Bruce used were each of a square foot in area. The table shows the area covered by Felicia’s tiles in terms of the number of tiles used.
Number of Tiles Area Covered (sq ft)
6 1
12 2
18 3
Bruce and Felicia want to know whose tiles cover the most area per tile
(Question I need help with is in the Screenshot)

Answers: 2


Another question on Mathematics
Mathematics, 21.06.2019 18:30
Find the constant of variation for the relation and use it to write an equation for the statement. then solve the equation.
Answers: 1
Mathematics, 21.06.2019 21:30
Name and describe the three most important measures of central tendency. choose the correct answer below. a. the mean, sample size, and mode are the most important measures of central tendency. the mean of a data set is the sum of the observations divided by the middle value in its ordered list. the sample size of a data set is the number of observations. the mode of a data set is its highest value in its ordered list. b. the sample size, median, and mode are the most important measures of central tendency. the sample size of a data set is the difference between the highest value and lowest value in its ordered list. the median of a data set is its most frequently occurring value. the mode of a data set is sum of the observations divided by the number of observations. c. the mean, median, and mode are the most important measures of central tendency. the mean of a data set is the product of the observations divided by the number of observations. the median of a data set is the lowest value in its ordered list. the mode of a data set is its least frequently occurring value. d. the mean, median, and mode are the most important measures of central tendency. the mean of a data set is its arithmetic average. the median of a data set is the middle value in its ordered list. the mode of a data set is its most frequently occurring value.
Answers: 3
Mathematics, 21.06.2019 22:00
You are standing next to a really big circular lake. you want to measure the diameter of the lake, but you don't want to have to swim across with a measuring tape! you decide to walk around the perimeter of the lake and measure its circumference, and find that it's 400\pi\text{ m}400? m. what is the diameter dd of the lake?
Answers: 3
Mathematics, 22.06.2019 00:00
City l has a temperature of −3 °f. city m has a temperature of −7 °f. use the number line shown to answer the questions: number line from negative 8 to positive 8 in increments of 1 is shown. part a: write an inequality to compare the temperatures of the two cities. (3 points) part b: explain what the inequality means in relation to the positions of these numbers on the number line. (4 points) part c: use the number line to explain which city is warmer. (3 points)
Answers: 2
You know the right answer?
Please Help ASAP!!
In this activity, you will use equations and graphs to represent real-world rela...
Questions

Mathematics, 12.02.2021 21:00
Mathematics, 12.02.2021 21:00
Mathematics, 12.02.2021 21:00
Mathematics, 12.02.2021 21:00

Mathematics, 12.02.2021 21:00

English, 12.02.2021 21:00
Mathematics, 12.02.2021 21:00

Social Studies, 12.02.2021 21:00
Mathematics, 12.02.2021 21:00

Biology, 12.02.2021 21:00
Social Studies, 12.02.2021 21:00


