
Mathematics, 01.01.2021 17:10 GgRed
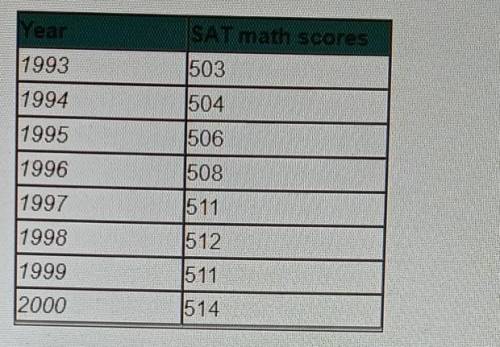
The table below shows the average SAT math scores from 1993-2002
Using the data from the table determine if there is a linear trend between the year and the average SAT math scores and determine if there is an exact linear fit of data. Describe the linear trend if there is one.
a. Positive linear trend, an exact linear fit.
b. Positive liner trend, not an exact linear fit.
c. Negative liner trend, not an exact linear fit.
d. Negative linear trend, an exact linear fit.

Answers: 1


Another question on Mathematics
Mathematics, 21.06.2019 16:00
Hello people, i have a math question that i need with, me, i will give the correct one brainiest, and for the other correct people, a and 5 stars.
Answers: 3
Mathematics, 21.06.2019 16:30
The hawaiian alphabet has 12 letters. how many permutations are posible for each number of letters?
Answers: 3
Mathematics, 21.06.2019 17:50
Which of these triangle pairs can be mapped to each other using two reflections?
Answers: 1
Mathematics, 22.06.2019 00:30
Astrid spent $36 on new shoes. this was $12 less than twice what she spent on a new skirt. part a: which equation would solve for how much she spent on the skirt? part b: solve the equation in the workspace provided below. how much did astrid spend on her skirt?
Answers: 1
You know the right answer?
The table below shows the average SAT math scores from 1993-2002
Using the data from the table dete...
Questions


Mathematics, 13.05.2021 18:10

Physics, 13.05.2021 18:10
Mathematics, 13.05.2021 18:10
Mathematics, 13.05.2021 18:10

English, 13.05.2021 18:10
Mathematics, 13.05.2021 18:10


Mathematics, 13.05.2021 18:10


