
Mathematics, 01.01.2021 22:30 mateotrevino1
I REALLY NEED HELP!!
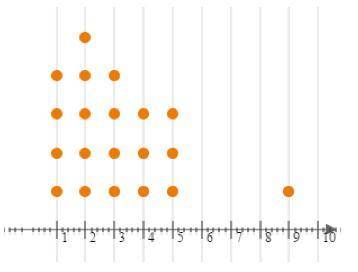
The data for numbers of times per week 20 students at Stackamole High eat vegetables are shown below:
Part A: Describe the dot plot.
Part B: What, if any, are the outliers in these data? Show your work.
Part C: What is the best measure of center for these data? Explain your reasoning.

Answers: 1


Another question on Mathematics
Mathematics, 21.06.2019 18:20
What are the solution(s) to the quadratic equation x2 – 25 = 0? o x = 5 and x = -5ox=25 and x = -25o x = 125 and x = -125o no real solution
Answers: 2
Mathematics, 21.06.2019 20:40
Sh what is the value of x? ox= 2.25 x = 11.25 ox= x = 22 1 (2x + 10) seo - (6x + 1) -- nie
Answers: 3
Mathematics, 21.06.2019 23:00
*segment an is an altitude of right ? abc with a right angle at a. if ab = 2root 5 in and nc = 1 in, find bn, an, ac.
Answers: 3
Mathematics, 22.06.2019 00:00
One of the complementary angles is 4 degrees mor than the other. find the angles (recall that complementary angles are angles whose sum is 90 degrees.) which of the following can not be used to solve the problem if x represents one of the angles? a. 2x-4=90 b. 2x+4=90 c. x+4=90
Answers: 1
You know the right answer?
I REALLY NEED HELP!!
The data for numbers of times per week 20 students at Stackamole High eat vege...
Questions


Chemistry, 03.08.2021 18:00

History, 03.08.2021 18:00


