
Mathematics, 02.01.2021 07:30 help977
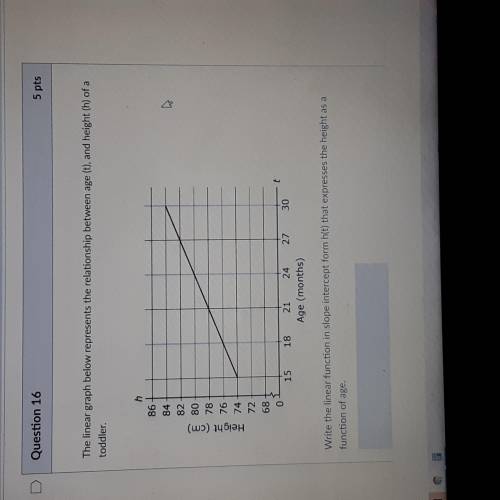
The linear graph below represents the relationship between age (t), and height (h) of a toddler. Write the linear function in slope intercept form h(t) that expresses the height as a function of age.

Answers: 3


Another question on Mathematics
Mathematics, 21.06.2019 23:00
Erik buys 2.5 pounds of cashews. if each pound of cashews costs $7.70, how much will he pay for the cashews?
Answers: 1
Mathematics, 22.06.2019 02:30
Last month, leonhard euler's watch kiosk at the mall had total sales of $9,489. merchandise totaling $225 was returned. the goods that were sold cost leonhard euler's $5,481. operating expenses for the moth were $992. what was the gross profit on sales?
Answers: 1
Mathematics, 22.06.2019 04:00
Sarah needs 3 feet of fabric for a project she is working on, but the store only sells the fabric in meters. one meter of fabric costs $1.20. how much will the fabric cost?
Answers: 2
Mathematics, 22.06.2019 05:30
Marshall went to the state fair and bought 3 tickets. each ticket to the fair cost x dollars. after he bought the tickets, he had $3.25 left in change. write an expression that represents the amount of money, in dollars, that marshall had before he bought the tickets. n
Answers: 1
You know the right answer?
The linear graph below represents the relationship between age (t), and height (h) of a toddler.
Wr...
Questions
Mathematics, 07.04.2021 18:20

Mathematics, 07.04.2021 18:20
Mathematics, 07.04.2021 18:20

Business, 07.04.2021 18:20
Mathematics, 07.04.2021 18:20


Mathematics, 07.04.2021 18:20

Physics, 07.04.2021 18:20
Mathematics, 07.04.2021 18:20
Mathematics, 07.04.2021 18:20

Mathematics, 07.04.2021 18:20
Biology, 07.04.2021 18:20


