
Mathematics, 02.01.2021 18:30 idcatall5
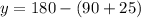
In the given figure, O is the centre of the circle. For
what values of x and y , chord BC will pass through
the centre of circle where points A, B and C are on
the circle?
(a) x = 90, y = 60 (b) x =75,y= 30
(c) x = 65, y = 90 (d) x =90, y = 65


Answers: 3


Another question on Mathematics
Mathematics, 21.06.2019 23:40
The frequency table shows the results of a survey asking people how many hours they spend online per week. on a piece of paper, draw a histogram to represent the data. then determine which answer choice matches the histogram you drew. in order here is the.. hours online: 0-3, 4-7, 8-11, 12-15, and 16-19. frequency: 5, 8, 10, 8, 7 answer for the question is in the picture! : )
Answers: 2
Mathematics, 22.06.2019 01:30
Need asap i will give brainliest and 98 points classify each pair of numbered angles corresponding, alternate interior, alternate exterior or none o these
Answers: 2
Mathematics, 22.06.2019 02:30
Aconstruction worker needs to put a rectangular window in the side of a building he knows from measuring that the top and bottom of the window have a width of 8bfeet and the sides have a length of 15 feet he also measured one diagonal to be 17 feet what is the length of the other diagonal
Answers: 1
Mathematics, 22.06.2019 02:30
The upcoming championship high school football game is a big deal in your little town. the problem is, it is being played in the next biggest town, which is two hours away! to get as many people as you can to attend the game, you decide to come up with a ride-sharing app, but you want to be sure it will be used before you put all the time in to creating it. you determine that if more than three students share a ride, on average, you will create the app. you conduct simple random sampling of 20 students in a school with a population of 300 students to determine how many students are in each ride-share (carpool) on the way to school every day to get a good idea of who would use the app. the following data are collected: 6 5 5 5 3 2 3 6 2 2 5 4 3 3 4 2 5 3 4 5 construct a 95% confidence interval for the mean number of students who share a ride to school, and interpret the results. part a: state the parameter and check the conditions. part b: construct the confidence interval. be sure to show all your work, including the degrees of freedom, critical value, sample statistics, and an explanation of your process. part c: interpret the meaning of the confidence interval. part d: use your findings to explain whether you should develop the ride-share app for the football game.
Answers: 3
You know the right answer?
In the given figure, O is the centre of the circle. For
what values of x and y , chord BC will pass...
Questions

English, 28.09.2021 18:40


Biology, 28.09.2021 18:40

Mathematics, 28.09.2021 18:40
Mathematics, 28.09.2021 18:40
Biology, 28.09.2021 18:40
Mathematics, 28.09.2021 18:40
Mathematics, 28.09.2021 18:40
Mathematics, 28.09.2021 18:40
English, 28.09.2021 18:40
Mathematics, 28.09.2021 18:40

Mathematics, 28.09.2021 18:40
Mathematics, 28.09.2021 18:40

Computers and Technology, 28.09.2021 18:40


