Mathematics, 04.01.2021 23:10 jaumonking
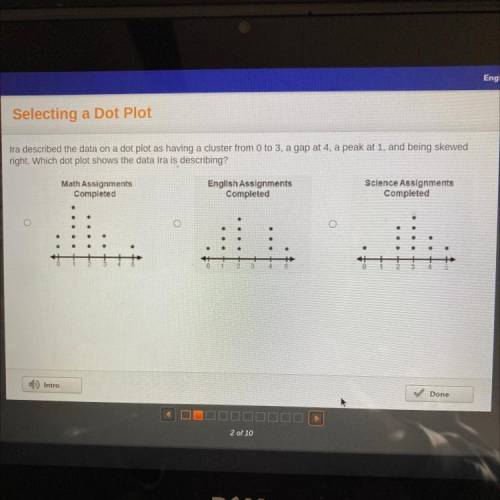
Ira described the data on a dot plot as having a cluster from 0 to 3, a gap at 4, and being skewed right. Which dot plot shows the data that Ira is describing?


Answers: 3


Another question on Mathematics

Mathematics, 21.06.2019 16:00
Which term best describes the association between variables a and b
Answers: 1

Mathematics, 21.06.2019 18:30
The distance between two cities is 368 miles. if the scale on the map is 1/4 inch=23 miles, what is the distance between the cities on the map?
Answers: 3

Mathematics, 21.06.2019 18:30
Find the constant of variation for the relation and use it to write an equation for the statement. then solve the equation.
Answers: 1

Mathematics, 21.06.2019 22:30
Acredit union pays 5% annual interest, compounded daily, on savings deposits. find the value after one year of $500 deposited in this account. $525.64 $25.64 $20.40 $520.40
Answers: 2
You know the right answer?
Ira described the data on a dot plot as having a cluster from 0 to 3, a gap at 4, and being skewed r...
Questions


Mathematics, 02.03.2021 17:10

English, 02.03.2021 17:10


Mathematics, 02.03.2021 17:10

Chemistry, 02.03.2021 17:10

English, 02.03.2021 17:10

Chemistry, 02.03.2021 17:10

Arts, 02.03.2021 17:20

Mathematics, 02.03.2021 17:20

Physics, 02.03.2021 17:20


Mathematics, 02.03.2021 17:20

History, 02.03.2021 17:20


Mathematics, 02.03.2021 17:20

Mathematics, 02.03.2021 17:20


Mathematics, 02.03.2021 17:20


