
Mathematics, 05.01.2021 02:50 abelxoconda
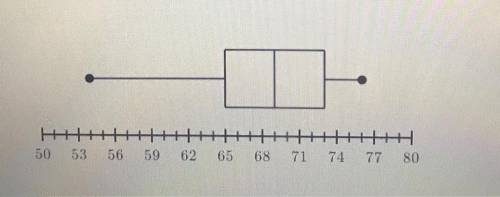
Which data set could be represented by the box plot shown below?
A. 54, 60, 65, 66, 67, 69, 70, 72, 73, 75, 76
B. 54, 60, 63, 66, 67, 68, 70, 72, 73, 75, 76
C. 54, 60, 65, 66, 67, 70, 72, 73, 75, 76
D. 53, 60, 65, 66, 67, 69, 70, 72, 73, 75, 76

Answers: 1


Another question on Mathematics
Mathematics, 21.06.2019 18:30
Can someone check if i did this correct. it’s number 4 if you’re wondering.
Answers: 1
Mathematics, 21.06.2019 18:40
The vertex of this parabola is at (-2,-3). when the x-value is -1, the y-value is -5. what is the coefficient of the squared expression in the parabola's equation?
Answers: 2
Mathematics, 21.06.2019 18:50
Determine if the function below is continuous. a. continuous b. not continuous, 1 hole c. not continuous, > 2 holes d. not continuous, 2 holes
Answers: 1
Mathematics, 21.06.2019 22:00
The number of calories you burn depends on your weight. a 110-pound person burns 163 calories during 30 minutes of tennis. find the number of calories that a 190-pound person would burn during the same activity, assuming they burn calories at the same rate.
Answers: 1
You know the right answer?
Which data set could be represented by the box plot shown below?
A. 54, 60, 65, 66, 67, 69, 70, 72,...
Questions


History, 05.07.2019 06:00
Mathematics, 05.07.2019 06:00
Mathematics, 05.07.2019 06:00

History, 05.07.2019 06:00

Mathematics, 05.07.2019 06:00
Mathematics, 05.07.2019 06:00
Mathematics, 05.07.2019 06:00

Mathematics, 05.07.2019 06:00


