
Mathematics, 05.01.2021 08:30 shelbycg02
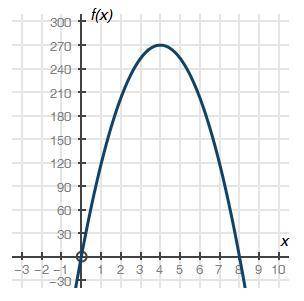
The graph below shows a company's profit f(x), in dollars, depending on the price of erasers x, in dollars, being sold by the company:
Part A: What do the x-intercepts and maximum value of the graph represent? What are the intervals where the function is increasing and decreasing, and what do they represent about the sale and profit? (6 points)
Part B: What is an approximate average rate of change of the graph from x = 1 to x = 4, and what does this rate represent? (4 points)
(10 points Total)

Answers: 1


Another question on Mathematics
Mathematics, 21.06.2019 19:00
Abacteria population is tripling every hour. by what factor does the population change in 1/2 hour? select all that apply
Answers: 1
Mathematics, 21.06.2019 23:00
Susie wants to take her friend out for lunch.she wants to spend $9.75 each person. how much will she spend in all.
Answers: 2
Mathematics, 22.06.2019 03:00
Which equation represents h in the triangle? a) h = 6sin37° b) h = 10sin37° c) h = 6 10 sin37° d) h = 10 6 sin37°
Answers: 1
You know the right answer?
The graph below shows a company's profit f(x), in dollars, depending on the price of erasers x, in d...
Questions


Mathematics, 20.11.2020 23:20

Biology, 20.11.2020 23:20

Social Studies, 20.11.2020 23:20

Computers and Technology, 20.11.2020 23:20
Mathematics, 20.11.2020 23:20
Engineering, 20.11.2020 23:20
Mathematics, 20.11.2020 23:20

Chemistry, 20.11.2020 23:20
Social Studies, 20.11.2020 23:20
Mathematics, 20.11.2020 23:20
Mathematics, 20.11.2020 23:20
Mathematics, 20.11.2020 23:20


