
Mathematics, 05.01.2021 22:00 ethanw8973
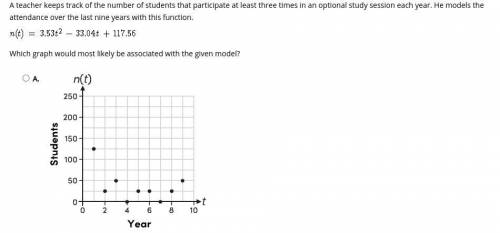
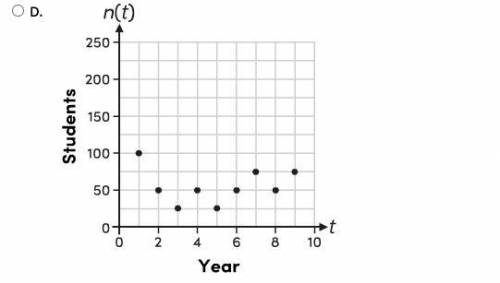
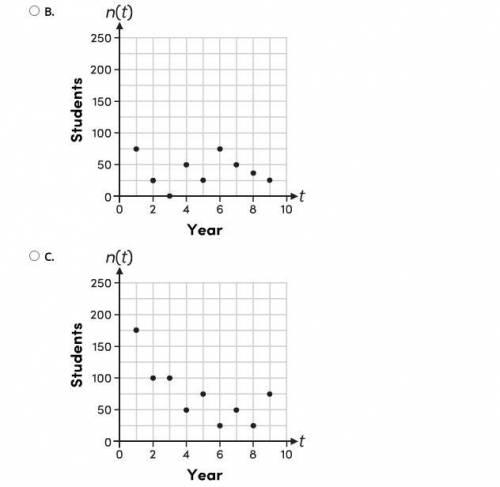
A teacher keeps track of the number of students that participate at least three times in an optional study session each year. He models the attendance over the last nine years with this function.
n(t)=3.53t2-33.04t+117.56
Which graph would most likely be associated with the given model?

Answers: 2


Another question on Mathematics
Mathematics, 21.06.2019 14:50
Eight people were asked what the balance of their savings account at the beginning of the month was and how much it increased or decreased by the end of the month. create a scatter plot that represents the data that is shown in the table. the x-axis represents the beginning balance in thousands of dollars and the y-axis represents the change in the savings account in hundreds of dollars. name beginning balance (in thousands of dollars) change in savings account (in hundreds of dollars) jimmy 5 3 kendra 4 7 carlos 5 4 yolanda 3 1 shawn 2 5 laura 3 2 andy 5 6 georgia 4 3
Answers: 1
Mathematics, 21.06.2019 15:00
Find the sum of the measure of the interior angles of a polygon of 9 sides ; of 32 sides
Answers: 1
Mathematics, 21.06.2019 16:00
The step function g(x) is defined as shown.what is the range of g(x)? ***answer choices in picture.
Answers: 3
Mathematics, 21.06.2019 17:30
1mile equals approximately 1.6 kilometers. which best approximates the number of miles in 6 kilometers?
Answers: 1
You know the right answer?
A teacher keeps track of the number of students that participate at least three times in an optional...
Questions

Business, 21.04.2021 07:40
Mathematics, 21.04.2021 07:40

Chemistry, 21.04.2021 07:40
Mathematics, 21.04.2021 07:40

History, 21.04.2021 07:40
Chemistry, 21.04.2021 07:40
Mathematics, 21.04.2021 07:40

Physics, 21.04.2021 07:40

English, 21.04.2021 07:40
Physics, 21.04.2021 07:40
English, 21.04.2021 07:40
Mathematics, 21.04.2021 07:40
Mathematics, 21.04.2021 07:40

Health, 21.04.2021 07:40


