
Mathematics, 05.01.2021 23:00 lenaeeee
(05.01)
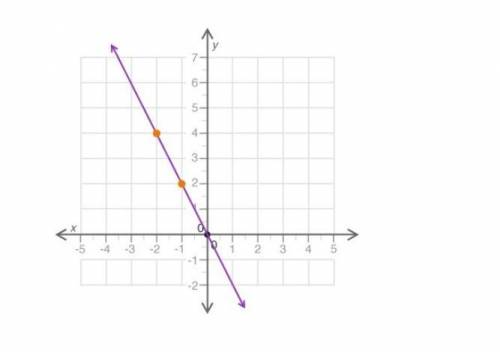
Which statement best explains if the graph correctly represents the proportional relationship y = −2x?
A coordinate plane is shown. Points are graphed at 2 comma 4 and negative 1 comma 2. The points are joined by a line.
No, the points shown would not be part of y = −2x
No, proportions cannot be represented on a graph
Yes, all proportions can be shown on a graph of this line
Yes, the points shown on the line would be part of y = −2x

Answers: 1


Another question on Mathematics
Mathematics, 21.06.2019 21:30
Two friends are reading books. jimmy reads a book with 21,356 words. his friend bob reads a book with one-and-a-half times as many words. which expression represents the number of words bob reads?
Answers: 3
Mathematics, 21.06.2019 22:30
Solve: 25 points find the fifth term of an increasing geometric progression if the first term is equal to 7−3 √5 and each term (starting with the second) is equal to the difference of the term following it and the term preceding it.
Answers: 1
Mathematics, 22.06.2019 00:00
Which of the following is the maximum value of the equation y=-x^2+2x+5 a. 5 b. 6 c. 2. d. 1
Answers: 1
Mathematics, 22.06.2019 00:00
Subtract and simplify. (-y^2 – 4y - 8) – (-4y^2 – 6y + 3) show how you got the answer if your answer is right i will mark you
Answers: 1
You know the right answer?
(05.01)
Which statement best explains if the graph correctly represents the proportional relationsh...
Questions

Mathematics, 23.08.2019 16:10


Mathematics, 23.08.2019 16:10
Mathematics, 23.08.2019 16:10
Mathematics, 23.08.2019 16:10
History, 23.08.2019 16:10

Mathematics, 23.08.2019 16:10

Business, 23.08.2019 16:10
Mathematics, 23.08.2019 16:10
Mathematics, 23.08.2019 16:10
SAT, 23.08.2019 16:10


