
Mathematics, 06.01.2021 01:50 Clivensp5
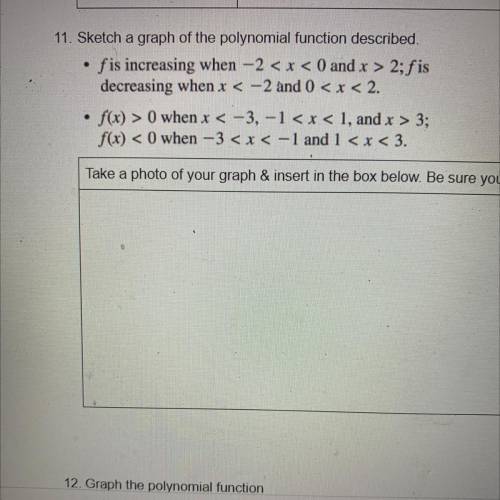
11. Sketch a graph of the polynomial function described.
fis increasing when -2 < x < 0 and x > 2;f is
decreasing when x < -2 and 0 < x < 2.
f(x) > 0 when x < -3, -1 3;
f(x) < 0 when -3 < x < -1 and 1 < x < 3.
one

Answers: 2


Another question on Mathematics
Mathematics, 21.06.2019 17:00
Find the value of the variable and the length of each secant segment.
Answers: 1
Mathematics, 21.06.2019 19:20
Which number line represents the solution set for the inequality - x 24?
Answers: 3
Mathematics, 21.06.2019 22:00
How many ordered pairs of positive integers satisfy xy=32?
Answers: 1
Mathematics, 21.06.2019 22:30
How can you find the mean absolute deviation (mad) for this set of data?
Answers: 3
You know the right answer?
11. Sketch a graph of the polynomial function described.
fis increasing when -2 < x < 0 and x...
Questions
Mathematics, 10.02.2021 01:00
Mathematics, 10.02.2021 01:00

Arts, 10.02.2021 01:00

Physics, 10.02.2021 01:00


History, 10.02.2021 01:00
Mathematics, 10.02.2021 01:00

Mathematics, 10.02.2021 01:00
Geography, 10.02.2021 01:00


