
Mathematics, 06.01.2021 20:10 brobles9118
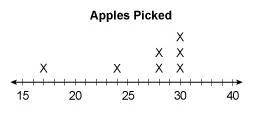
The dot plot represents the number of apples picked by a family. Explain how the outlier of the data affects the statistical summary of the data.
Select the answers from the drop-down menus to complete the statements.
The mean apples picked
Choose...Increases, Decreases, Do Not Change
because of the outlier.
The median apples picked
Choose...Increases, Decreases, Do Not Change
because of the outlier.
The range
Choose...Increases, Decreases, Do Not Change
because of the outlier.

Answers: 3


Another question on Mathematics
Mathematics, 21.06.2019 16:20
Find the slope of a line given the following two points
Answers: 1
Mathematics, 21.06.2019 17:00
Tim's phone service charges $23.06 plus an additional $0.22 for each text message sent per month. if tim's phone bill was $28.56, which equation could be used to find how many text messages, x, tim sent last month?
Answers: 2
Mathematics, 21.06.2019 18:30
If you have the following equation, 2/3x+5/6-x=2-3/4x what would you multiply each term by to get rid of all the fractions
Answers: 3
You know the right answer?
The dot plot represents the number of apples picked by a family. Explain how the outlier of the data...
Questions
Mathematics, 09.03.2021 20:20
Mathematics, 09.03.2021 20:20
Mathematics, 09.03.2021 20:20


History, 09.03.2021 20:20
Mathematics, 09.03.2021 20:20
Mathematics, 09.03.2021 20:20
Mathematics, 09.03.2021 20:20
History, 09.03.2021 20:20
Mathematics, 09.03.2021 20:20
Mathematics, 09.03.2021 20:20
Mathematics, 09.03.2021 20:20

Geography, 09.03.2021 20:20

English, 09.03.2021 20:20
Mathematics, 09.03.2021 20:20


