
Mathematics, 07.01.2021 17:20 cicilee49
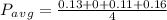
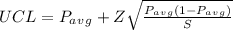
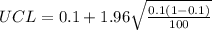
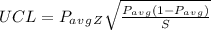
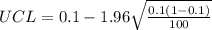
The chair of the operations management department at Quality University wants to construct a p-chart for determining whether the four faculty teaching the basic P/OM course are in control with regard to the number of students who fail the course. Accordingly, he sampled 100 final grades from last year for each instructor, with the following results Instructor Number of Failures Prof. A 13 Prof. B 0 Prof. C 11 Prof. D 16 What are the .95 (5 percent risk of Type I error) upper and lower control limits for the p-chart

Answers: 2


Another question on Mathematics
Mathematics, 21.06.2019 13:10
What graph correctly matches the equation y equals two negative x
Answers: 1
Mathematics, 21.06.2019 14:30
Each morning papa notes the birds feeding on his bird feeder. so far this month he has see. 59 blue jays, 68 black crows, 12 red robin's and 1 cardinal. what is the probability of a blue jay being the next bird papa sees
Answers: 3
Mathematics, 21.06.2019 17:00
Scarlet bought three pairs of sunglasses and two shirts for $81 and paula bought one pair of sunglasses and five shirts for $105 what is the cost of one pair of sunglasses and one shirt?
Answers: 2
You know the right answer?
The chair of the operations management department at Quality University wants to construct a p-chart...
Questions

Physics, 18.03.2020 04:17


Biology, 18.03.2020 04:18
English, 18.03.2020 04:18

Computers and Technology, 18.03.2020 04:18
Mathematics, 18.03.2020 04:18


History, 18.03.2020 04:18
Mathematics, 18.03.2020 04:19


