
Mathematics, 07.01.2021 21:20 cooboy
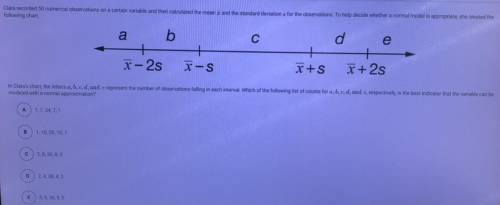
Clara recorded 50 numerical observations on a certain variable and then calculated the mean and the standard deviations for the observations. To help decide whether a normal model is appropriate, she created the
following chart
a
b
с
d
e
X-2s
X-S
X+S
X + 2s
In Clara's chart, the letters a, b, c, d, and c represent the number of observations falling in each interval. Which of the following list of counts for a, b, c, d, and e, respectively, is the best indicator that the variable can be
modeled with a normal approximation?
А
1.7,34,7,1
1,10,28, 10,1
С
2,8, 30, 8,2
D
2, 4, 38, 4,2
E
5,5, 30,5,5

Answers: 3


Another question on Mathematics
Mathematics, 21.06.2019 21:00
Describe how making an ‘and’ compound sentence effects your solution set
Answers: 1
Mathematics, 21.06.2019 22:00
Given the quadratic function f(x)=3x^2-24x+49 a. use “completing the squares” to convert the quadratic function into vertex form b. state the vertex c. find the x and y intercepts d. graph the function
Answers: 1
Mathematics, 21.06.2019 23:30
Scenario: susan wants to make 2 square flags to sell at a crafts fair. the fabric she wants to buy is 3 meters wide. she doesn't want any fabric left over. what's the least amount of fabric she should buy? question: which equation will susan solve her problem? note: let x represent the length of 1 side of the flag. options: 1) 2x^2 = 4x 2) 8 +2x = 2(4x) 3) 2 * 2 = 4 * 2 4) 4x^2 -2x = 0
Answers: 2
You know the right answer?
Clara recorded 50 numerical observations on a certain variable and then calculated the mean and the...
Questions


Chemistry, 23.04.2021 01:00
Mathematics, 23.04.2021 01:00

French, 23.04.2021 01:00

Geography, 23.04.2021 01:00


Spanish, 23.04.2021 01:00
Mathematics, 23.04.2021 01:00
Mathematics, 23.04.2021 01:00

Biology, 23.04.2021 01:00
Mathematics, 23.04.2021 01:00


