
Mathematics, 08.01.2021 01:00 muziqbox594
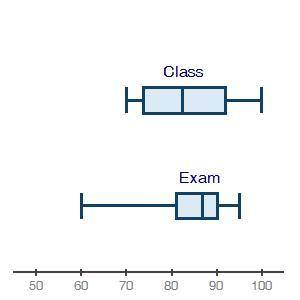
The box plots below show student grades on the most recent exam compared to overall grades in the class:
Which of the following best describes the information about the medians? (1 point)
a
The exam outlier at 60 makes the IQR narrower and the median higher.
b
The class data is more evenly spread, which pulls its median down.
c
The class median is lower than the exam median.
d
The class Q3 is higher than the exam Q3.
I know alot of people have gotten this wrong and the answer is not The class Q3 is higher than the exam Q3. If you can help me you will also be helping others who need the answer to this question so this will greatly be appreciated.

Answers: 2


Another question on Mathematics
Mathematics, 21.06.2019 20:00
Evaluate the discriminant of each equation. tell how many solutions each equation has and whether the solutions are real or imaginary. x^2 + 4x + 5 = 0
Answers: 2
Mathematics, 22.06.2019 00:30
Anew test for ra is being developed. the test is administered to 750 patients with ra and 750 without ra. for the sake of the question, assume the prevalence of ra in this population is 50%. of the 750 patients with ra, 575 have a positive result. of the 750 patients without ra, 150 have a positive result. what is the positive predictive value of the new test? a575/(575+150) b. 600/(600+ 150) c. 575/(575+125) d. 600/(600+ 125)
Answers: 2
You know the right answer?
The box plots below show student grades on the most recent exam compared to overall grades in the cl...
Questions

Chemistry, 12.04.2021 21:10
Mathematics, 12.04.2021 21:10


Biology, 12.04.2021 21:10
Mathematics, 12.04.2021 21:10
Biology, 12.04.2021 21:10


World Languages, 12.04.2021 21:10
Chemistry, 12.04.2021 21:10
Mathematics, 12.04.2021 21:10
Mathematics, 12.04.2021 21:10


