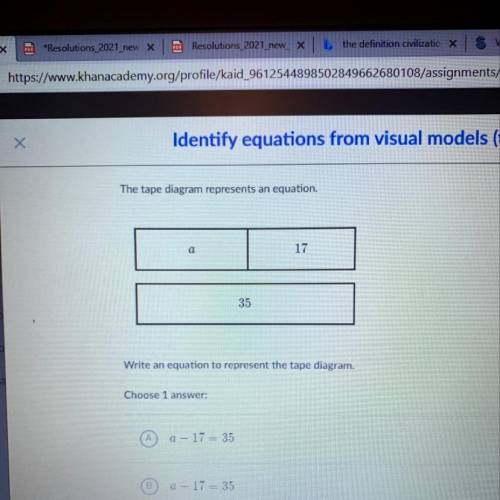
The tape diagram represents an equation.
a
17
35
Write an equation to represent t...

Mathematics, 08.01.2021 03:40 deanaprettelt7444
The tape diagram represents an equation.
a
17
35
Write an equation to represent the tape diagram

Answers: 2


Another question on Mathematics
Mathematics, 21.06.2019 18:30
The table shows the relationship between the number of cups of cereal and the number of cups of raisins in a cereal bar recipe: number of cups of cereal number of cups of raisins 8 2 12 3 16 4 molly plotted an equivalent ratio as shown on the grid below: a graph is shown. the title of the graph is cereal bars. the horizontal axis label is cereal in cups. the x-axis values are 0, 20, 40, 60, 80,100. the vertical axis label is raisins in cups. the y-axis values are 0, 10, 20, 30, 40, 50. a point is plotted on the ordered pair 40,20. which of these explains why the point molly plotted is incorrect? (a) if the number of cups of cereal is 40, then the number of cups of raisins will be10. (b)if the number of cups of raisins is 40, then the number of cups of cereal will be10. (c) if the number of cups of cereal is 40, then the number of cups of raisins will be 80. (d) if the number of cups of raisins is 40, then the number of cups of cereal will be 80.
Answers: 1
Mathematics, 21.06.2019 20:30
Give the functions f(x) = |x + 2| - 3, what is the domain? a,b,c, or d all real numbers x > 2 x < -2 all real numbers and x cannot equal to 2
Answers: 1
Mathematics, 21.06.2019 20:30
List x1, x2, x3, x4 where xi is the left endpoint of the four equal intervals used to estimate the area under the curve of f(x) between x = 4 and x = 6. a 4, 4.5, 5, 5.5 b 4.5, 5, 5.5, 6 c 4.25, 4.75, 5.25, 5.75 d 4, 4.2, 5.4, 6
Answers: 1
You know the right answer?
Questions


Mathematics, 04.04.2020 13:17
Mathematics, 04.04.2020 13:17
English, 04.04.2020 13:17


English, 04.04.2020 13:17


