Mathematics, 08.01.2021 05:30 slrich21
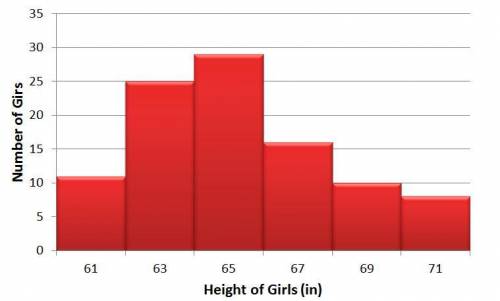
The histogram shows a distribution of girls' heights in inches.
Which statement best describes the distribution?
A.
The data is positively skewed because the majority of the data is clustered to the left of the center.
B.
The data is negatively skewed because the majority of the data is clustered to the left of the center.
C.
The data is positively skewed because the majority of the data is clustered to the right of the center.
D.
The data is negatively skewed because the majority of the data is clustered to the right of the center.


Answers: 1


Another question on Mathematics

Mathematics, 21.06.2019 17:30
When a rectangle is dilated, how do the perimeter and area of the rectangle change?
Answers: 2

Mathematics, 21.06.2019 19:20
Which letters from the table represent like terms? a and b b and c a and d b and d
Answers: 3

Mathematics, 21.06.2019 22:10
Akitchen is 12 ft. by 14 ft. with 10 ft. high walls. how much would it cost to put vinyl flooring in this room? $8.80 per ft
Answers: 1

Mathematics, 22.06.2019 00:00
Sun country bus lines has 80000 shares of stock outstanding what would the dividend per share of stock be from a dividends declaration of 109600
Answers: 1
You know the right answer?
The histogram shows a distribution of girls' heights in inches.
Which statement best describes the...
Questions

Mathematics, 21.05.2020 10:58

Mathematics, 21.05.2020 10:58


Social Studies, 21.05.2020 10:58


Chemistry, 21.05.2020 10:58


Computers and Technology, 21.05.2020 10:58

Mathematics, 21.05.2020 10:58

Mathematics, 21.05.2020 10:58

Mathematics, 21.05.2020 10:58


English, 21.05.2020 10:58

Chemistry, 21.05.2020 10:58


Mathematics, 21.05.2020 10:58

Mathematics, 21.05.2020 10:58


