
Mathematics, 08.01.2021 21:40 xaxtusgod
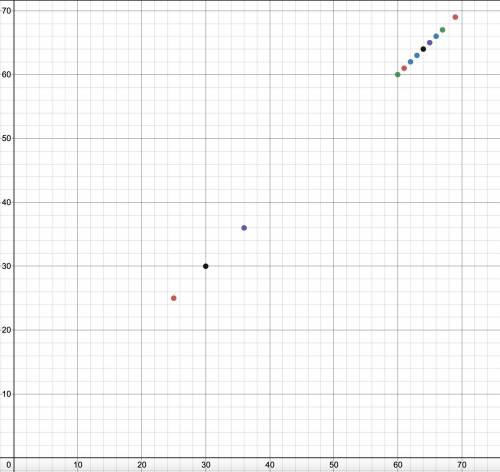
1. Which variable did you plot on the x-axis, and which variable did you plot on the y-axis? Explain why you assigned the variables in that way.
2. Write the equation of the line of best fit using the slope-intercept formula $y = mx + b$. Show all your work, including the points used to determine the slope and how the equation was determined.
3. What does the slope of the line represent within the context of your graph? What does the y-intercept represent?
4. Test the residuals of two other points to determine how well the line of best fit models the data.
I've included a picture of my graph down below I just really need number 1 and 2 at the moment but any question answered through 1 and 4 would we very appreciated :) thank you very much :D I will be reporting answers that aren't correct, silly, or unhelpful because I just really need these answers and it only allows up to 2 people to answer.

Answers: 3


Another question on Mathematics
Mathematics, 21.06.2019 14:30
Simonne used the following steps to simplify the given expression. 12 - 3(-2x + 4) step 1: 12 + (–3)·(–2x) + (–3)·(4) step 2: 12 + 6x + (–12) step 3: 12 + (–12) + 6x step 4: 0 + 6x step 5: 6x what property of real numbers was used to transition from step 3 to step 4? a. identity property of addition b. inverse property of addition c. associative property of addition d. commutative property of addition
Answers: 3
Mathematics, 21.06.2019 21:10
What is the measure of one interior angle of a pentagon
Answers: 2
You know the right answer?
1. Which variable did you plot on the x-axis, and which variable did you plot on the y-axis? Explain...
Questions
Mathematics, 05.05.2021 07:30

English, 05.05.2021 07:30
Mathematics, 05.05.2021 07:30
Mathematics, 05.05.2021 07:30

Biology, 05.05.2021 07:30

Mathematics, 05.05.2021 07:30
Mathematics, 05.05.2021 07:30
Mathematics, 05.05.2021 07:30

French, 05.05.2021 07:30

History, 05.05.2021 07:40


