Mathematics, 08.01.2021 22:40 tilievaughn14
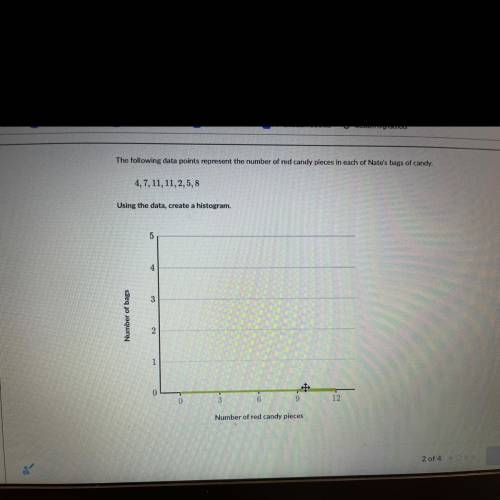
The following data points represent the number of red candy pieces in each of Nate's bags of candy.
4, 7, 11, 11,2,5,8
Using the data, create a histogram


Answers: 1


Another question on Mathematics

Mathematics, 21.06.2019 19:00
Which statement best explains why ben uses the width hi to create the arc at j from point k
Answers: 2

Mathematics, 22.06.2019 00:30
$5400 is? invested, part of it at 11? % and part of it at 8? %. for a certain? year, the total yield is ? $522.00. how much was invested at each? rate?
Answers: 1

Mathematics, 22.06.2019 02:00
Use long division to indentify (12xto the second power+15x-8)divided by 3x
Answers: 2

Mathematics, 22.06.2019 06:00
If it worker is paid $8.16 per hour and worked 8.5 hours in one week how much is he or she paid for that week
Answers: 1
You know the right answer?
The following data points represent the number of red candy pieces in each of Nate's bags of candy....
Questions


Mathematics, 05.05.2021 01:00

Biology, 05.05.2021 01:00


History, 05.05.2021 01:00

English, 05.05.2021 01:00


Mathematics, 05.05.2021 01:00


Mathematics, 05.05.2021 01:00


Mathematics, 05.05.2021 01:00

Mathematics, 05.05.2021 01:00


Mathematics, 05.05.2021 01:00

English, 05.05.2021 01:00


Mathematics, 05.05.2021 01:00


