Mathematics, 08.01.2021 23:30 22mhenton
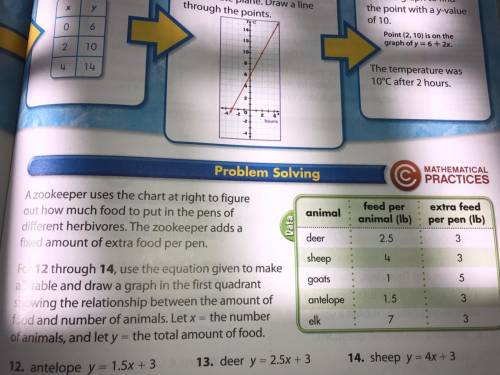
For 12 through 14, use the equation given to make
a T-table and draw a graph in the first quadrant
showing the relationship between the amount of
food and number of animals. Let x = the number
of animals, and let y = the total amount of food.
Need help on 12-13


Answers: 1


Another question on Mathematics

Mathematics, 21.06.2019 21:30
Yesterday, george drank 1 small bottle and 2 large bottles, for a total of 1,372 grams. the day before , he drank 1 small bottle and 1 large bottle, for the total of 858 grams. how many grams does each bottle hold?
Answers: 1

Mathematics, 21.06.2019 22:40
Select the point that is a solution to the system of inequalities. y< =-x+3 y=x^(2)-3x
Answers: 3

Mathematics, 21.06.2019 23:00
Frank has a devised a formula for his catering business that calculates the number of meatballs he needs to prepare. the formula is m=4a+2c, where c=number of children; m=number of meatballs; a=number of adults. how many meatballs are required for a party of 10 adults and 5 children?
Answers: 1

Mathematics, 21.06.2019 23:30
What is the ratio for the surface areas of the cones shown below, given that they are similar and that the ratio of their radii and altitudes is 2: 1? submit
Answers: 1
You know the right answer?
For 12 through 14, use the equation given to make
a T-table and draw a graph in the first quadrant<...
Questions

Mathematics, 27.09.2020 14:01


Mathematics, 27.09.2020 14:01

Mathematics, 27.09.2020 14:01


Mathematics, 27.09.2020 14:01

Biology, 27.09.2020 14:01

Biology, 27.09.2020 14:01

History, 27.09.2020 14:01

English, 27.09.2020 14:01

History, 27.09.2020 14:01


History, 27.09.2020 14:01


