
Mathematics, 11.01.2021 01:00 TornSnowFlake336
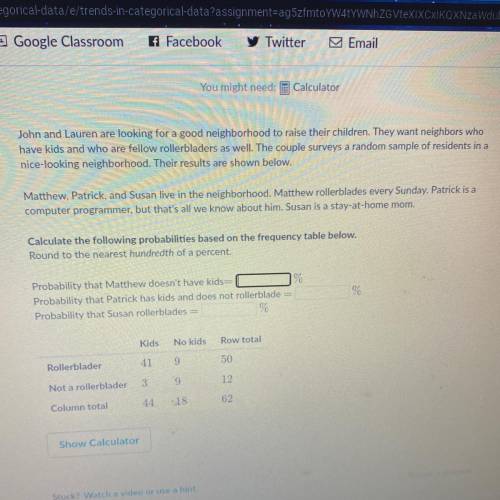
John and Lauren are looking for a good neighborhood to raise their children. They want neighbors who
have kids and who are fellow rollerbladers as well. The couple surveys a random sample of residents in a
nice-looking neighborhood. Their results are shown below.
Matthew, Patrick, and Susan live in the neighborhood. Matthew rollerblades every Sunday. Patrick is a
computer programmer, but that's all we know about him. Susan is a stay-at-home mom.
Calculate the following probabilities based on the frequency table below.
Round to the nearest hundredth of a percent.
Probability that Matthew doesn't have kids=
%
Probability that Patrick has kids and does not rollerblade =
Probability that Susan rollerblades =
%
%
Kids
No kids
Row total
Rollerblader
41
9
50
Not a rollerblader
3
9
12
Column total
44
-18
62

Answers: 2


Another question on Mathematics
Mathematics, 21.06.2019 15:30
For one history test, keith had to answer 40 questions. of these 40 questions, keith answered 28 of them correctly. what percent did keith get on his history test? round your answer to the nearest tenth if necessary
Answers: 1
Mathematics, 21.06.2019 22:00
15 points what is the end behavior of this graph? & what is the asymptote of this graph?
Answers: 1
Mathematics, 22.06.2019 01:50
Check all that apply. f is a function. f is a one-to-one function. c is a function. c is a one-to-one function.
Answers: 1
Mathematics, 22.06.2019 04:30
For the function f(x)=1/x-2 +5 notice that a=1, h=2, k=5 what are the vertical and horizontal asymoptote
Answers: 1
You know the right answer?
John and Lauren are looking for a good neighborhood to raise their children. They want neighbors who...
Questions

Mathematics, 02.10.2020 14:01

History, 02.10.2020 14:01

Mathematics, 02.10.2020 14:01
Mathematics, 02.10.2020 14:01
Mathematics, 02.10.2020 14:01
Mathematics, 02.10.2020 14:01

Biology, 02.10.2020 14:01
Mathematics, 02.10.2020 14:01
Mathematics, 02.10.2020 14:01
History, 02.10.2020 14:01
Social Studies, 02.10.2020 14:01


