
Mathematics, 11.01.2021 01:40 kimsouther2
Please help me
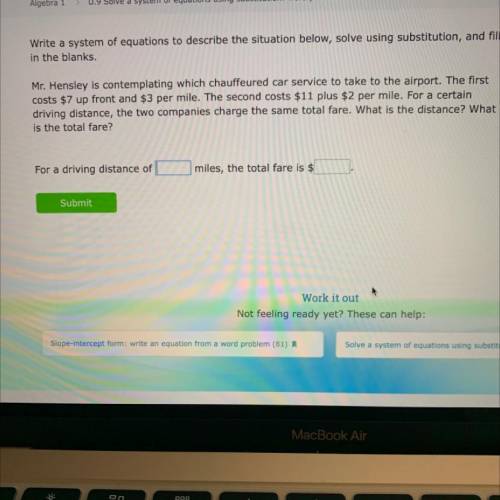
Mr. Hensley is contemplating which chauffeured car service to take to the airport. The first
costs $7 up front and $3 per mile. The second costs $11 plus $2 per mile. For a certain
driving distance, the two companies charge the same total fare. What is the distance? What
is the total fare?
For a driving distance of
miles, the total fare is $

Answers: 3


Another question on Mathematics
Mathematics, 21.06.2019 14:00
Which pair of lines is parallel? a. y=4x+1 and y+4=5 b. y=-2+x and 2y-2x=-2 c. y=1/4x + 2 and y-2=1/2x d. y=1/5x+1 and 5y+x= 10
Answers: 2
Mathematics, 21.06.2019 15:10
Aline parallel to a triangle's side splits ab into lengths of x - 5 and x + 2. the other side, ac, is split into lengths of x and x + 12. what is the length of ac? a) 12 b) 24 c) 36 d)
Answers: 1
Mathematics, 21.06.2019 15:30
In the figure below, segment ac is congruent to segment ab: triangle abc with a segment joining vertex a to point d on side bc. side ab is congruent to side ac which statement is used to prove that angle abd is congruent to angle acd? segment ad bisects angle cab. triangle acd is similar to triangle abd. segment ad is congruent to segment ac. angle cab is congruent to angle cba.
Answers: 2
Mathematics, 21.06.2019 16:00
Part one: measurements 1. measure your own height and arm span (from finger-tip to finger-tip) in inches. you will likely need some from a parent, guardian, or sibling to get accurate measurements. record your measurements on the "data record" document. use the "data record" to you complete part two of this project. name relationship to student x height in inches y arm span in inches archie dad 72 72 ginelle mom 65 66 sarah sister 64 65 meleah sister 66 3/4 67 rachel sister 53 1/2 53 emily auntie 66 1/2 66 hannah myself 66 1/2 69 part two: representation of data with plots 1. using graphing software of your choice, create a scatter plot of your data. predict the line of best fit, and sketch it on your graph. part three: the line of best fit include your scatter plot and the answers to the following questions in your word processing document 1. 1. which variable did you plot on the x-axis, and which variable did you plot on the y-axis? explain why you assigned the variables in that way. 2. write the equation of the line of best fit using the slope-intercept formula $y = mx + b$. show all your work, including the points used to determine the slope and how the equation was determined. 3. what does the slope of the line represent within the context of your graph? what does the y-intercept represent? 5. use the line of best fit to you to describe the data correlation.
Answers: 2
You know the right answer?
Please help me
Mr. Hensley is contemplating which chauffeured car service to take to the airport. T...
Questions
Mathematics, 11.09.2020 17:01
Mathematics, 11.09.2020 17:01
Mathematics, 11.09.2020 17:01

English, 11.09.2020 17:01
Mathematics, 11.09.2020 17:01
Mathematics, 11.09.2020 17:01

Physics, 11.09.2020 17:01
Mathematics, 11.09.2020 17:01
Mathematics, 11.09.2020 17:01
Mathematics, 11.09.2020 17:01

History, 11.09.2020 17:01
English, 11.09.2020 17:01
English, 11.09.2020 17:01
Mathematics, 11.09.2020 17:01
Mathematics, 11.09.2020 17:01
Mathematics, 11.09.2020 17:01

Health, 11.09.2020 17:01
Mathematics, 11.09.2020 17:01
English, 11.09.2020 17:01
Mathematics, 11.09.2020 17:01


