
Mathematics, 11.01.2021 02:20 jaumonking
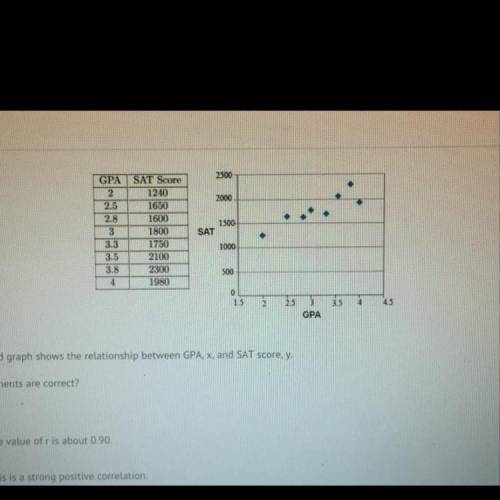
The table and graph shows the relationship between GPA, X, and SAT score, y.
Which statements are correct?
A) The value if r is about 0.90.
B) This is a strong positive correlation.
C) High GPA scores are not associated with SAT scores.
D) The equation y=0.00185x-0.21851 models the data.
E) There is not linear relationship between GPA and SAT scores.

Answers: 1


Another question on Mathematics
Mathematics, 21.06.2019 16:00
What are the related frequencies to the nearest hundredth of the columns of the two way table? group 1: a-102 b-34group 2: a-18 b-14edited: i don’t have all day to be waiting for an answer. i figured it out.
Answers: 2
Mathematics, 22.06.2019 00:00
Which is a logical conclusion based on the given information? a. figure abcd is a rhombus by the definition of a rhombus. b. segment ac is congruent to segment dc by cpctc. c. angle acb is congruent to angle adc by the angle-side-angle theorem. d. triangle acd is congruent to triangle cab by the hypotenuse-leg theorem.
Answers: 1
You know the right answer?
The table and graph shows the relationship between GPA, X, and SAT score, y.
Which statements are c...
Questions
Mathematics, 30.10.2019 22:31


History, 30.10.2019 22:31


Physics, 30.10.2019 22:31
Biology, 30.10.2019 22:31

Mathematics, 30.10.2019 22:31
English, 30.10.2019 22:31
Mathematics, 30.10.2019 22:31
Mathematics, 30.10.2019 22:31
Physics, 30.10.2019 22:31


