
Mathematics, 11.01.2021 18:10 KingKayyy9177
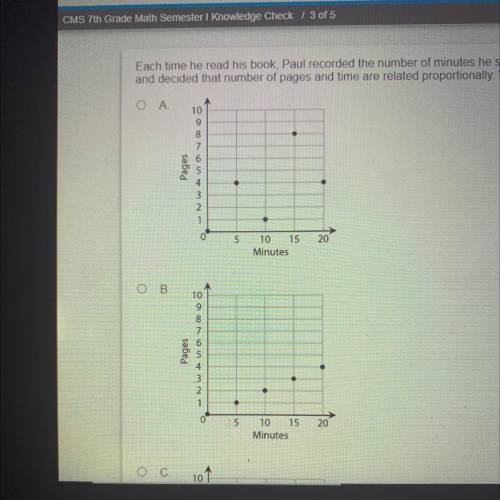
Each time he read his book, Paul recorded the number of minutes he spent reading and the number of pages he read in that time. He graphed this information, and decided that number of pages and time are related proportionally. Which graph is most likely the graph of his information? ( this is the answer choice A, b)

Answers: 1


Another question on Mathematics
Mathematics, 21.06.2019 20:30
I’m on question 7 it says a covered water tank is in the shape of a cylinder the tank has a 28 inch diameter and a height of 66 inches to the nearest square inch what is the surface area of the water tank
Answers: 2
Mathematics, 21.06.2019 21:50
6x + 3y = -6 2x + y = -2 a. x = 0, y = -2 b. infinite solutions c. x = -1, y = 0 d. no solution
Answers: 1
Mathematics, 21.06.2019 22:20
Select the correct answer from each drop-down menu. the table shows the annual sales revenue for different types of automobiles from three automobile manufacturers. sales revenue (millions of dollars) suv sedan truck marginal total b & b motors 22 15 9 46 pluto cars 25 27 10 62 panther motors 26 34 12 72 marginal total 73 76 31 180 the company with the highest percentage of sales revenue from sedans is . of the annual sales revenue from suvs, the relative frequency of pluto cars is .
Answers: 1
You know the right answer?
Each time he read his book, Paul recorded the number of minutes he spent reading and the number of p...
Questions

Business, 09.07.2019 08:30


Mathematics, 09.07.2019 08:30


Social Studies, 09.07.2019 08:30
Mathematics, 09.07.2019 08:30


Chemistry, 09.07.2019 08:30


