
Mathematics, 11.01.2021 18:30 fredvales19
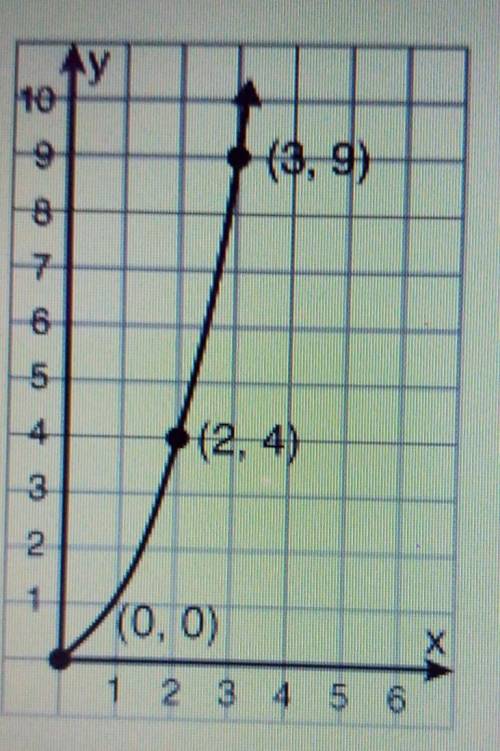
Determine whether the following graph is a direct variation. Explain how you came to your conclusion.

Answers: 2


Another question on Mathematics
Mathematics, 21.06.2019 16:30
Marco is studying a type of mold that grows at a fast rate. he created the function f(x) = 345(1.30)x to model the number of mold spores per week. what does the 1.30 represent? how many mold spores are there after 4 weeks? round your answer to the nearest whole number. 1.30 represents the number of mold spores marco had at the beginning of the study; 985 mold spores 1.30 represents the number of mold spores grown in a given week; 448 mold spores 1.30 represents the 30% rate of weekly growth; 345 mold spores 1.30 represents the 30% rate of weekly growth; 985 mold spores
Answers: 1
Mathematics, 21.06.2019 18:00
The sat and act tests use very different grading scales. the sat math scores follow a normal distribution with mean 518 and standard deviation of 118. the act math scores follow a normal distribution with mean 20.7 and standard deviation of 5. suppose regan scores a 754 on the math portion of the sat. how much would her sister veronica need to score on the math portion of the act to meet or beat regan's score?
Answers: 1
Mathematics, 22.06.2019 01:10
Jobs and productivity! how do retail stores rate? one way to answer this question is to examine annual profits per employee. the following data give annual profits per employee (in units of 1 thousand dollars per employee) for companies in retail sales. assume σ ≈ 4.0 thousand dollars. 3.7 6.7 3.6 8.5 7.5 5.9 8.7 6.4 2.6 2.9 8.1 −1.9 11.9 8.2 6.4 4.7 5.5 4.8 3.0 4.3 −6.0 1.5 2.9 4.8 −1.7 9.4 5.5 5.8 4.7 6.2 15.0 4.1 3.7 5.1 4.2 (a) use a calculator or appropriate computer software to find x for the preceding data. (round your answer to two decimal places.) thousand dollars per employee (b) let us say that the preceding data are representative of the entire sector of retail sales companies. find an 80% confidence interval for μ, the average annual profit per employee for retail sales. (round your answers to two decimal places.) lower limit -- thousand dollars upper limit -- thousand dollars (c) let us say that you are the manager of a retail store with a large number of employees. suppose the annual profits are less than 3 thousand dollars per employee. do you think this might be low compared with other retail stores? explain by referring to the confidence interval you computed in part (b). yes. this confidence interval suggests that the profits per employee are less than those of other retail stores. no. this confidence interval suggests that the profits per employee do not differ from those of other retail stores. correct: your answer is correct. (d) suppose the annual profits are more than 6.5 thousand dollars per employee. as store manager, would you feel somewhat better? explain by referring to the confidence interval you computed in part (b). yes. this confidence interval suggests that the profits per employee are greater than those of other retail stores. no. this confidence interval suggests that the profits per employee do not differ from those of other retail stores. (e) find an 95% confidence interval for μ, the average annual profit per employee for retail sales. (round your answers to two decimal places.) lower limit 3.75 incorrect: your answer is incorrect. thousand dollars upper limit 6.41 incorrect: your answer is incorrect. thousand dollars
Answers: 3
You know the right answer?
Determine whether the following graph is a direct variation. Explain how you came to your conclusion...
Questions

History, 13.04.2021 18:40


English, 13.04.2021 18:40
History, 13.04.2021 18:40
Mathematics, 13.04.2021 18:40


Chemistry, 13.04.2021 18:40
History, 13.04.2021 18:40


Spanish, 13.04.2021 18:40
Chemistry, 13.04.2021 18:40
Mathematics, 13.04.2021 18:40


